ProjectsSeries
Europe's Divides
Where Europe splits: by income, by vote and by citizenship. Interactive pages built on official statistics, each with its sources and data files.
Each page takes one question and answers it with official data only, from Eurostat, the national
statistical offices and returning officers, UNHCR and UCDP. Every figure can be traced to its source, and
every page lists its sources and links to its data files.
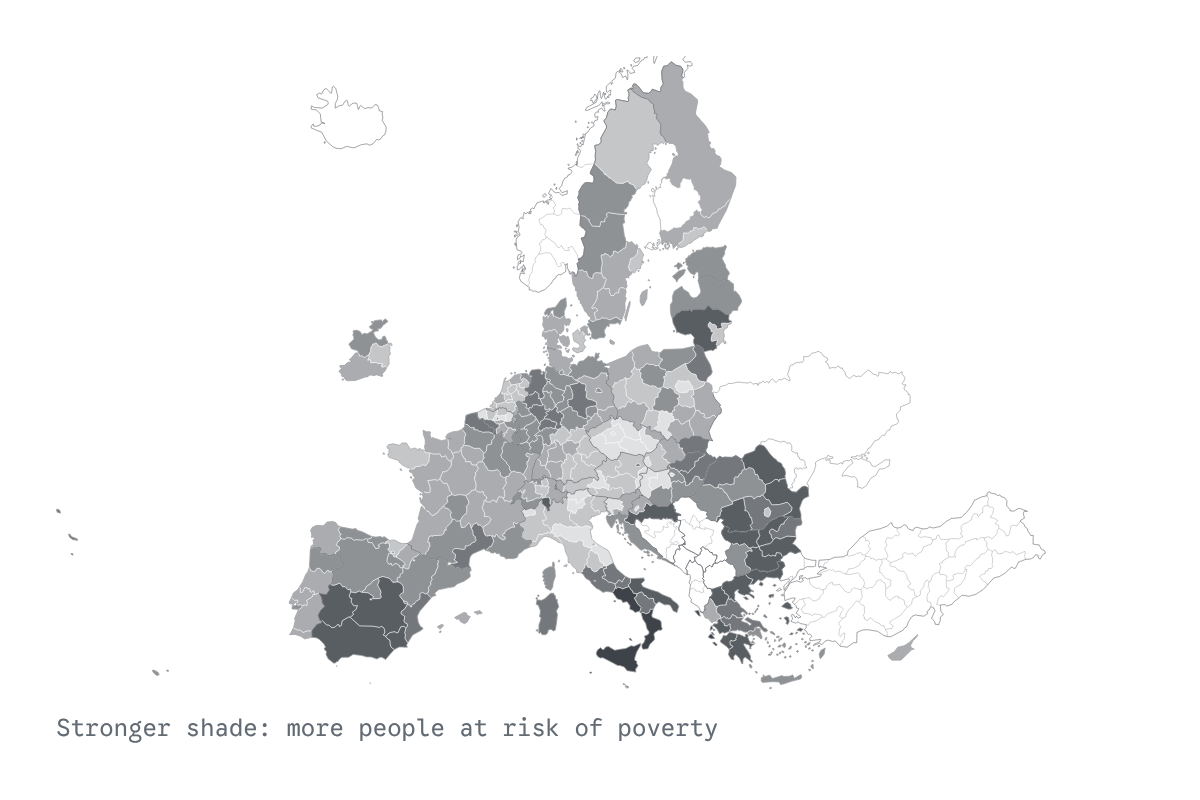
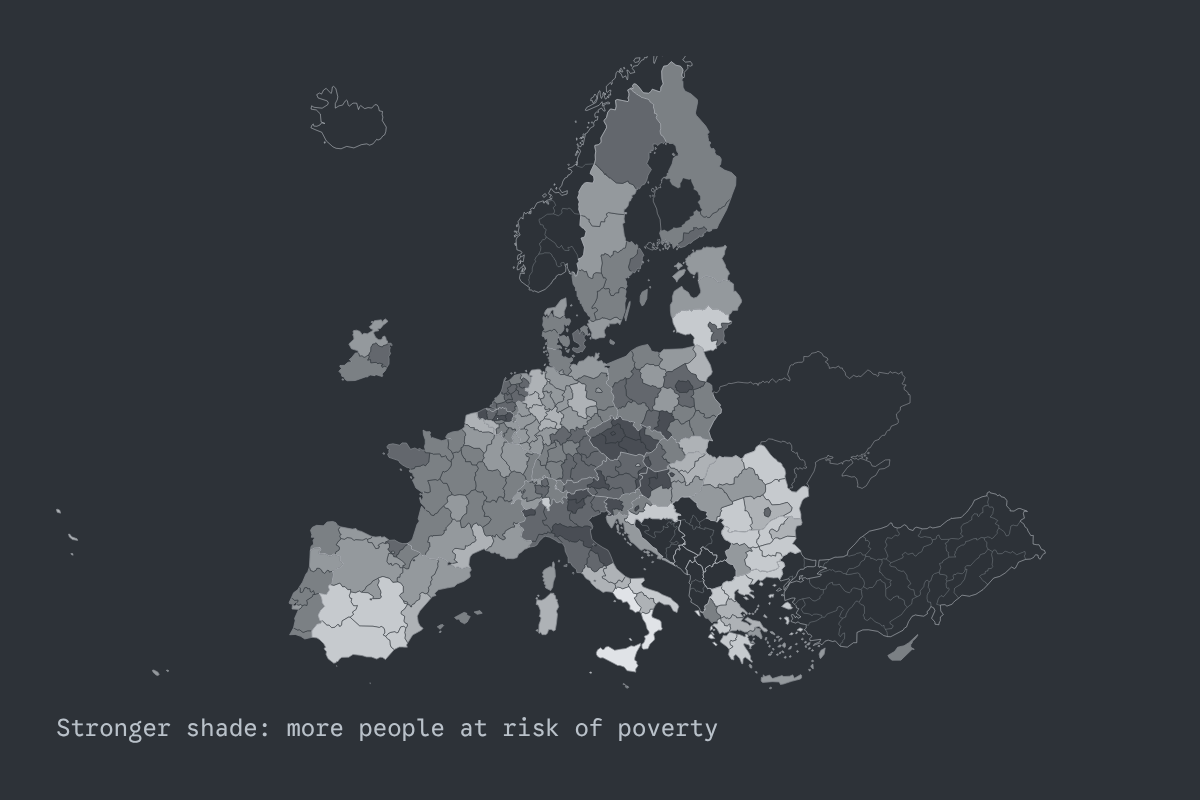
Do poorer regions of Europe vote less, and more for the far right? The 2024 European election, region by region.
Two questions about the 2024 European election, asked of every NUTS-2 region with the same measures: did poorer regions turn out less, and did they vote more for the far right? One answer per country, and the map to check it.
Open Poverty and the Vote →
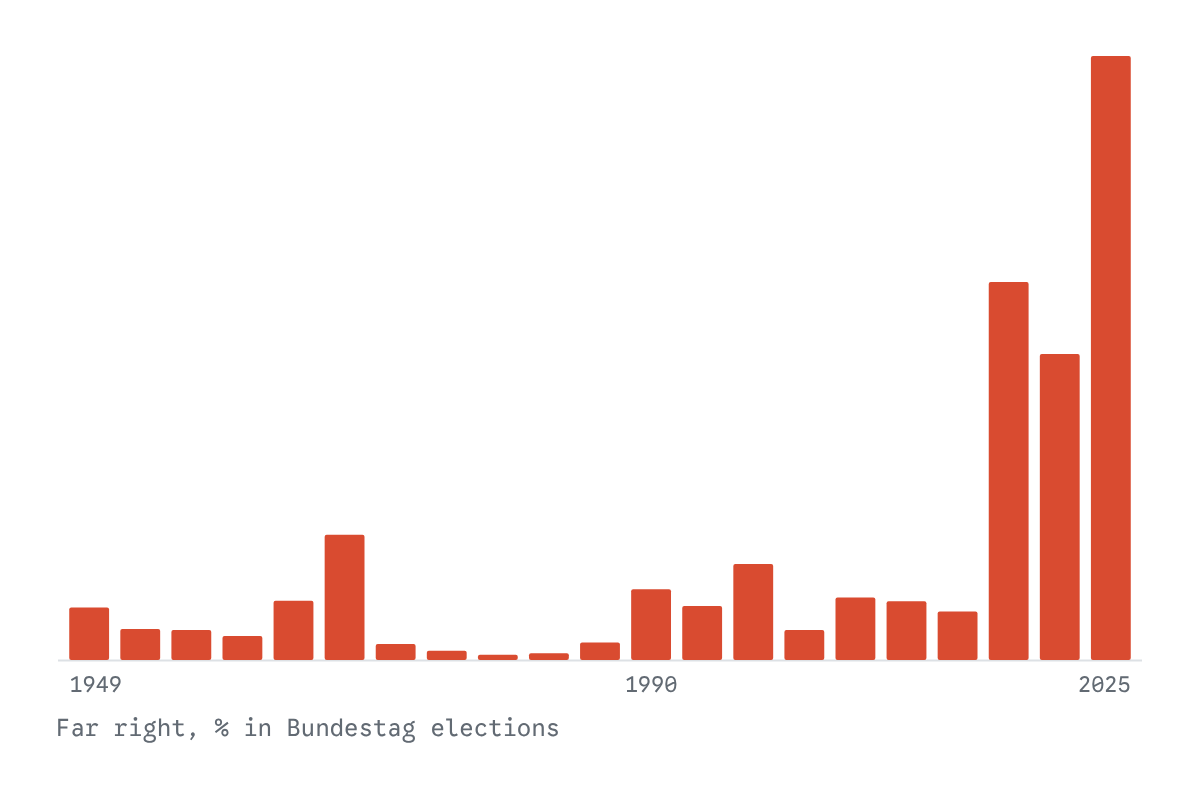
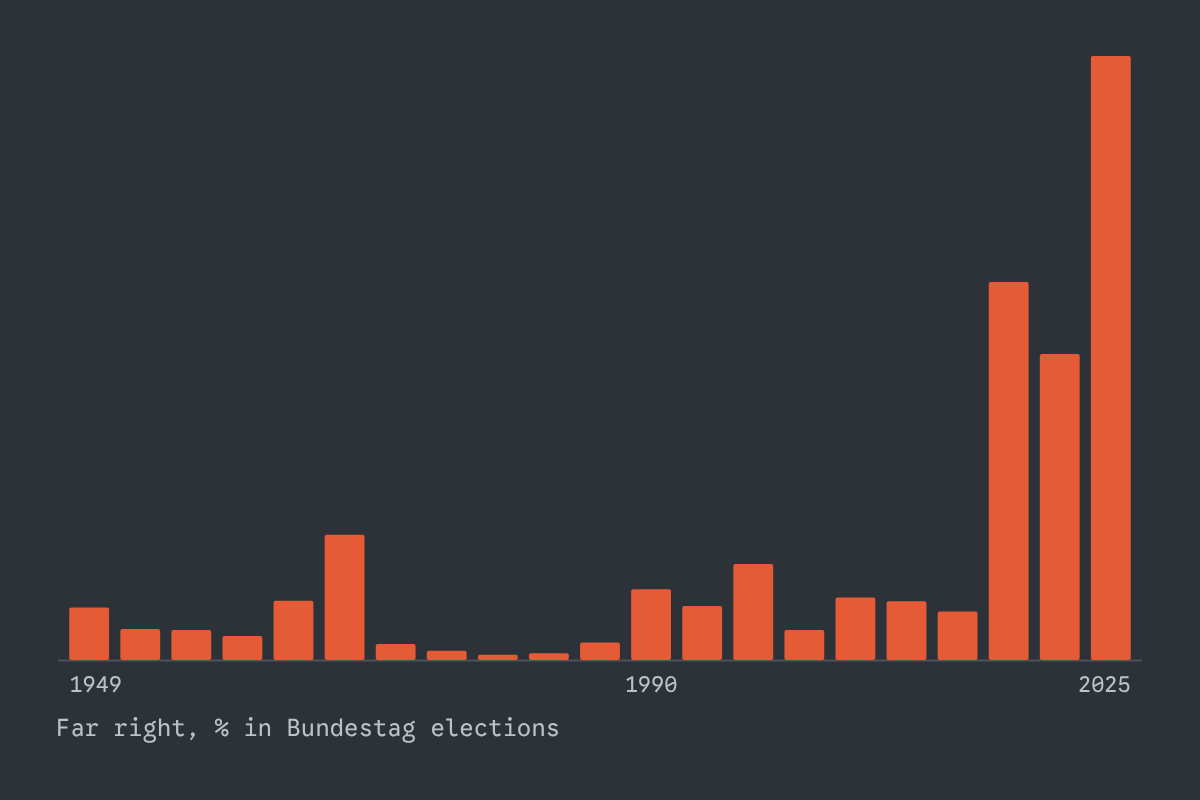
Every state and federal election since 1946: how far-right parties rose, fell and rose again.
The earlier waves of far-right parties and the AfD beside them: where each rose and fell, state by state, and from the federal map down to county and municipality.
Open The Far Right in Germany →
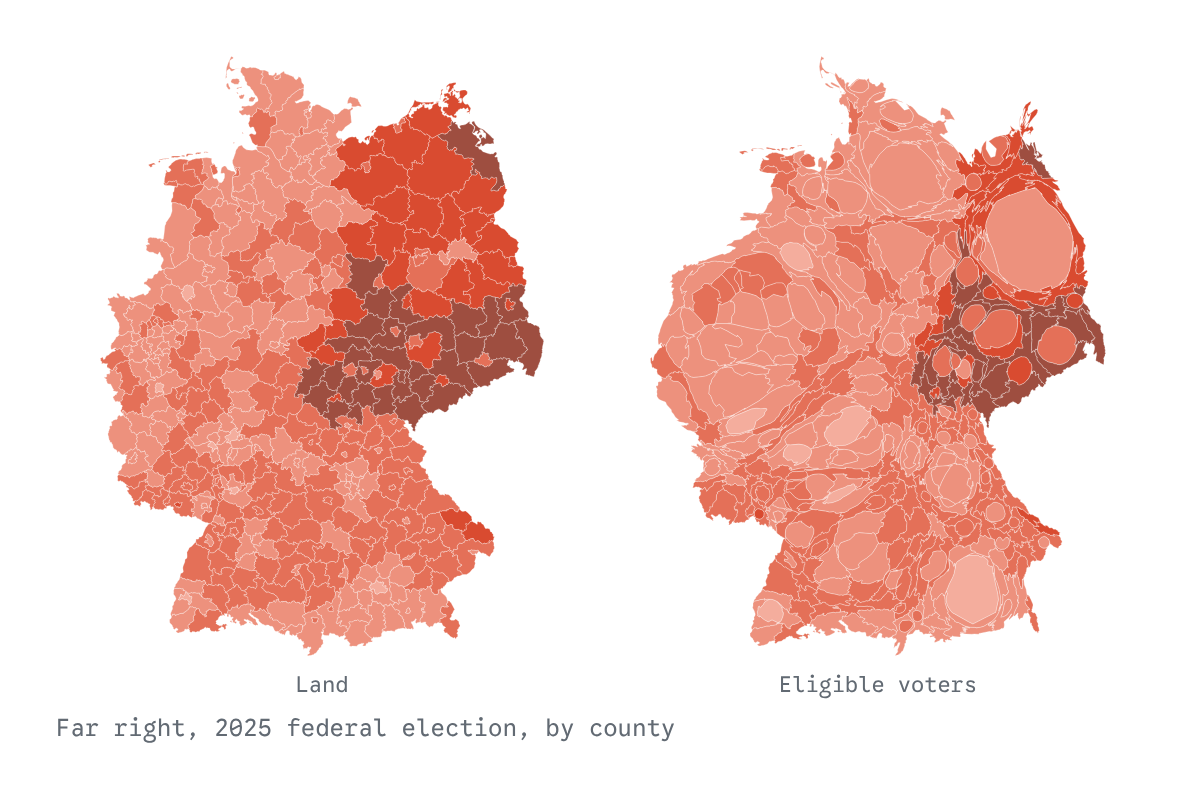
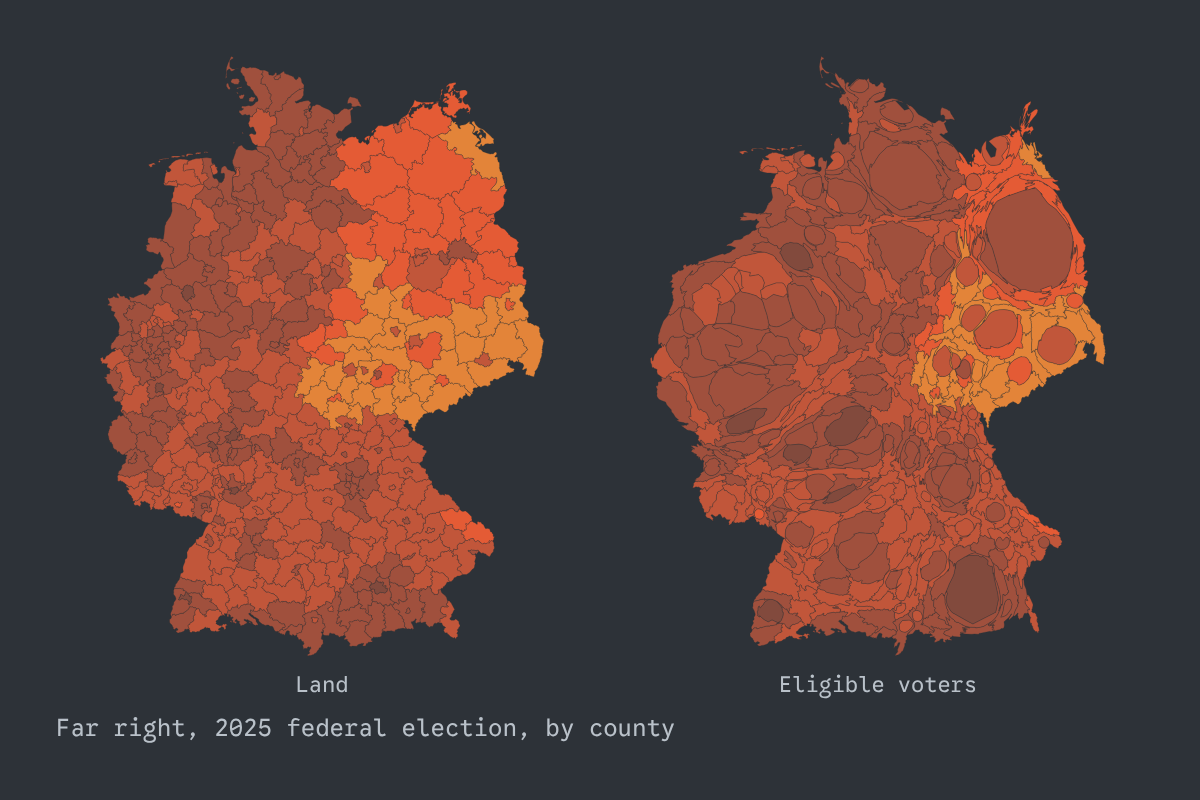
Land doesn’t vote, people do: Germany’s federal elections since 1953 drawn by eligible voters.
The usual county map makes the far right look stronger than it was, because thinly populated counties fill most of it. The same results drawn four more ways, sized by the people eligible to vote, show what each map shows and hides.
Open Area Doesn’t Vote →
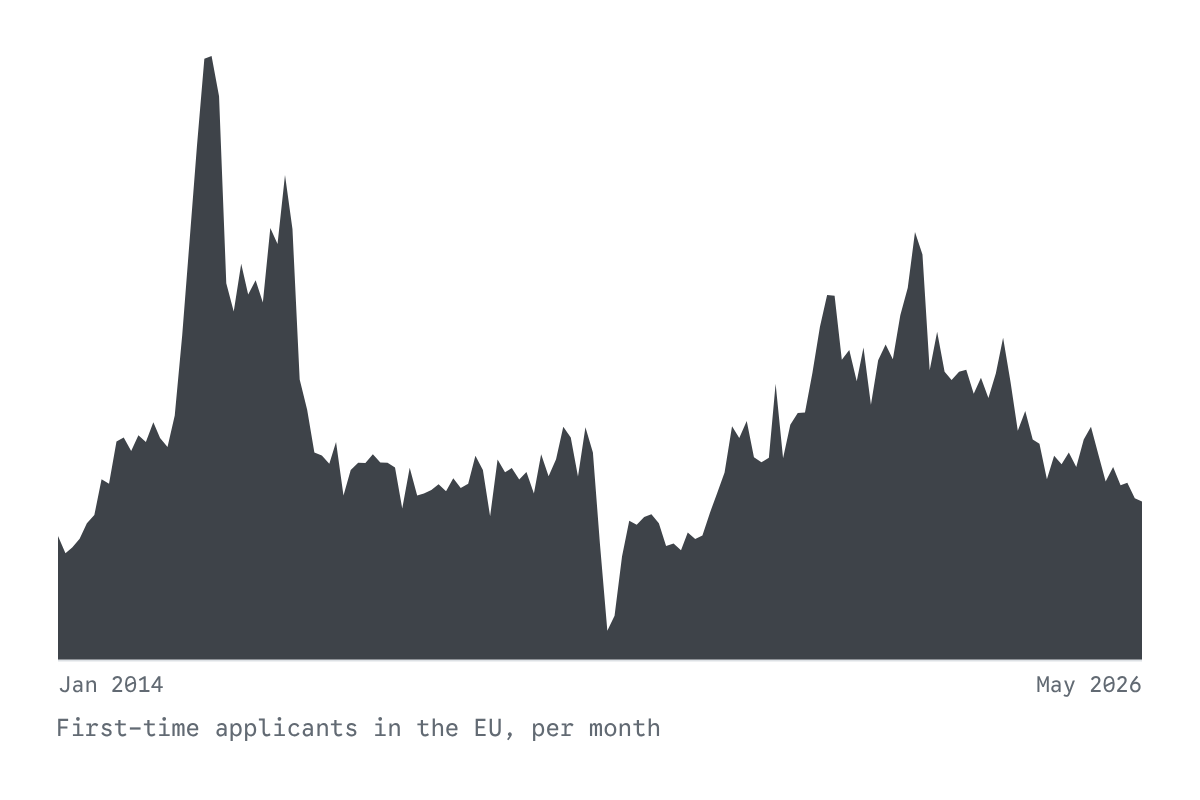
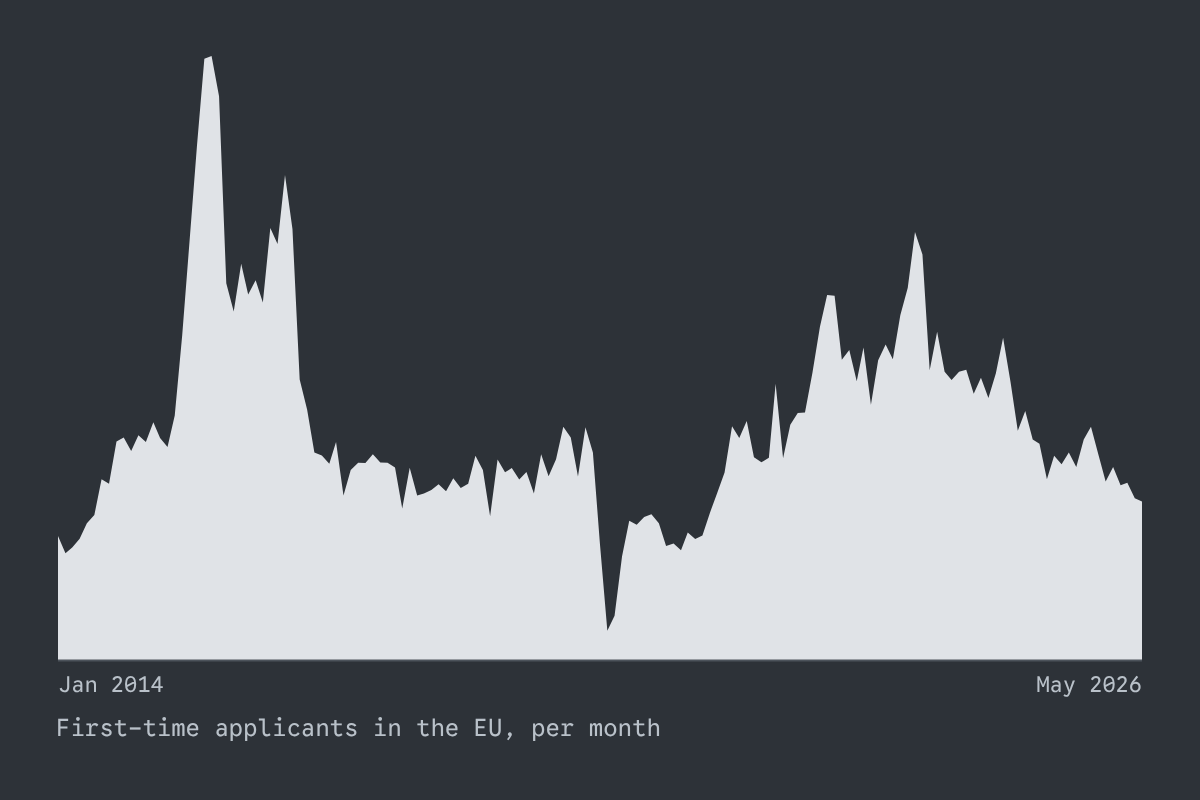
Who asks for asylum in the EU and Switzerland, which citizenship they hold and in which country they apply: every month since 2014, from Eurostat’s official statistics.
Every month since 2014, from official statistics: who applies for asylum, from which citizenship and where, what is decided, and beside it UNHCR’s refugee figures and the deaths from organised violence that UCDP counts.
Open Asking for Protection →