I came across this topic in a recent LinkedIn post by investigative journalist Daniel Drepper. An international research network investigated the spread of PFAS (per- and polyfluoroalkyl substances) to unveil the scale of pollution. These chemicals are linked to various diseases such as cancer and infertility. As a result, PFAS are estimated to account for between 52 and 84 billion euros in costs for European health systems – each year. Making this threat transparent to the public is the aim of the Forever Pollution Project.
The interesting part besides reporting and displaying the widespread contamination by PFAS with often incredibly high levels is the fact the Forever Pollution Project made all data available. I think that this is a truly smart move, not only in terms of transparency, but also to increase trust in their analysis. People like me can easily access the data and explore it themselves. And that’s what I did…
I had a look at their expert dataset. And as is often the case with spatial data, using a map is the way to go. Now, there are various approaches to visualise spatial data using different tools. However, since I wanted to avoid downloading and processing the data before feeding it into a visualisation tool, I decided to build a Shiny app in R. Shiny lets R programmers (soon available for Python, too) quickly build interactive visualisations and share these via shinyapps.io for free. That is simply great!
The resulting app lets you
- get an overview of the entire dataset; that is, all 33 countries instead of just Germany, for example,
- filter for specific characteristics (only groundwater sites in Hamburg, Germany),
- access all information for a specific site, and
- come across biases and flaws in the data.
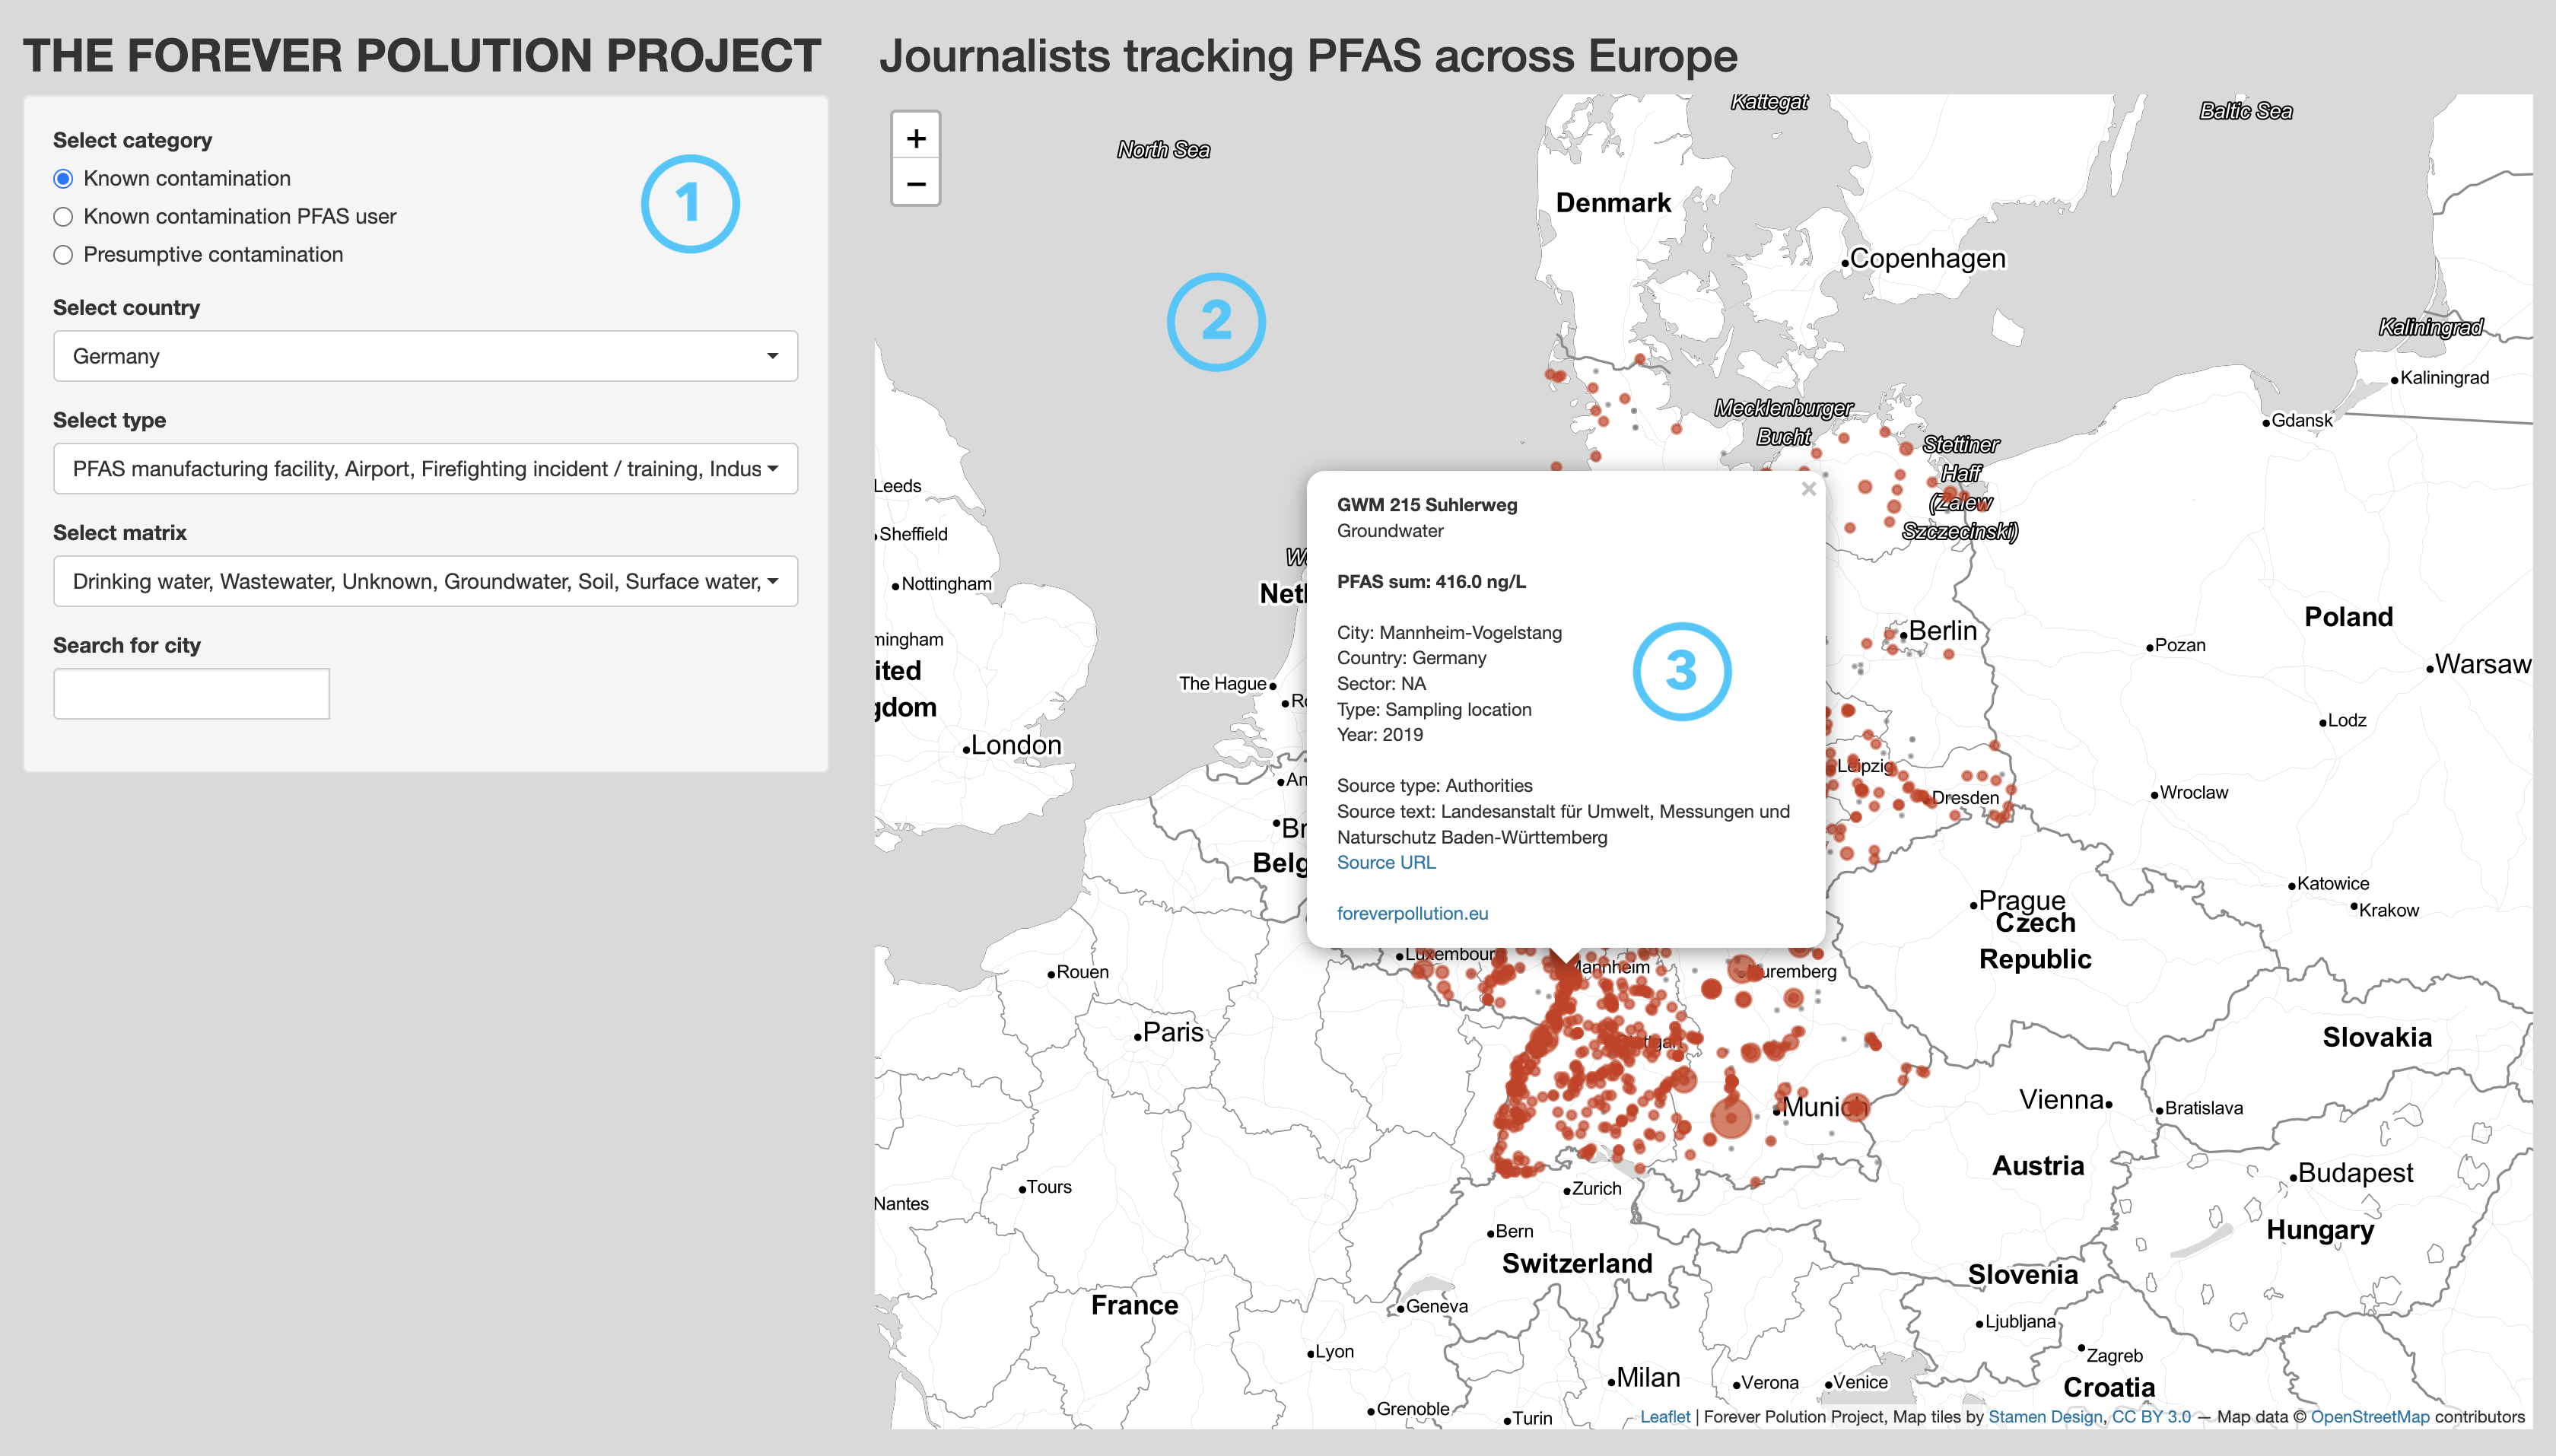
In short, these are the main parts:
1 – side panel
Lets you adjust the view to specific interests. One can choose between three different contamination categories, select one or more countries as well as site and matrix types, and search for a specific city.
2 – map
Lets you quickly locate sites based on the choices made in the side panel.
3 – tooltip
Provides all information available for a specific site as well as links to the source and the project itself.
Note: Whenever you see any bugs or want to suggest improvements, please, feel free to contact me!