ProjectsSeries
Swiss Democracy Lab
Swiss direct democracy in numbers: federal votes since 1875 and National Council elections since 1971, from the federal statistics.
Switzerland votes on federal proposals several times a year and elects its National Council every four
years. These pages follow both over the long run, canton by canton and commune by commune, from the
Federal Statistical Office’s results.
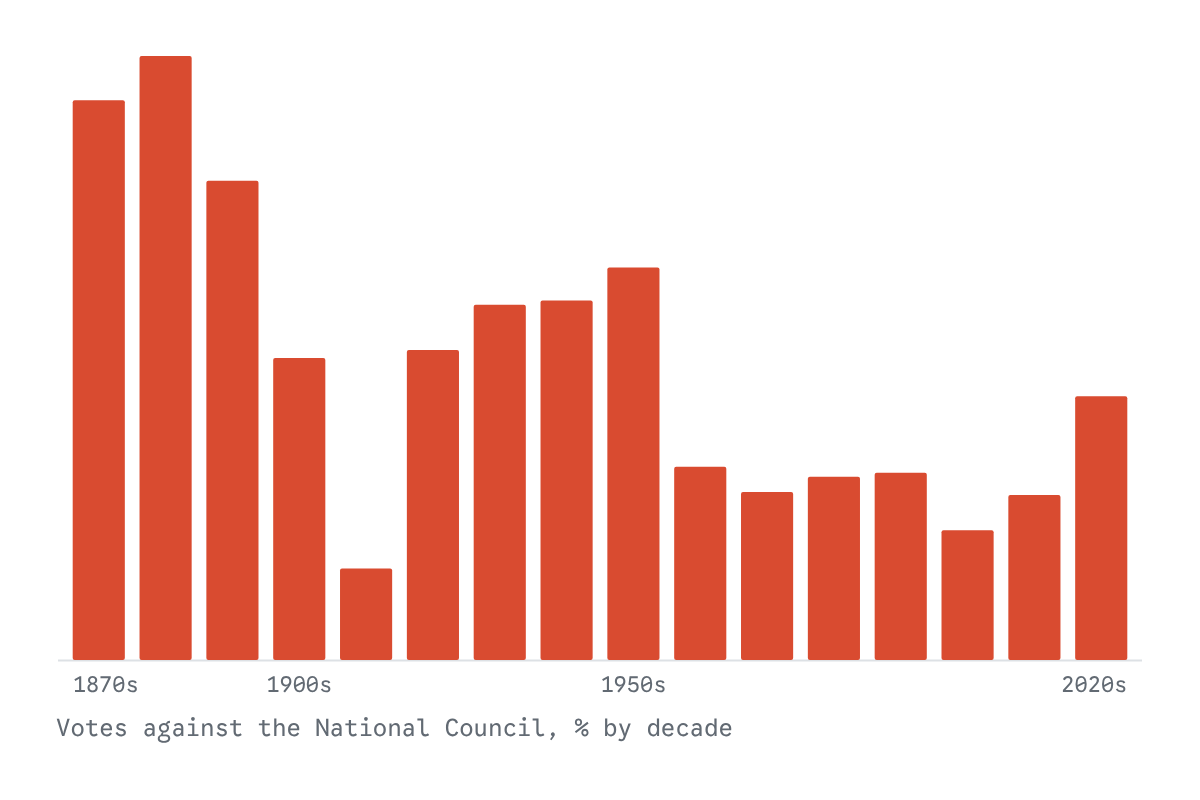
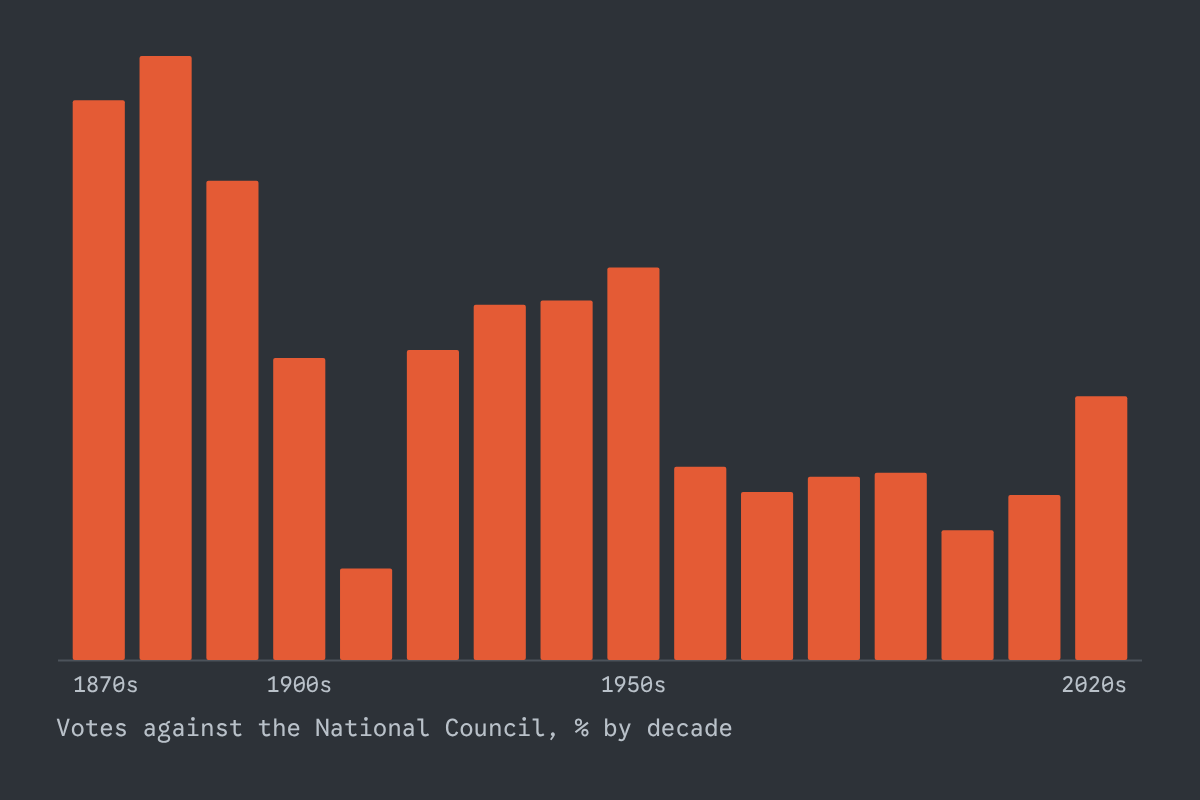
How often Swiss voters went against the National Council’s majority, vote by vote since 1875.
In Switzerland the people have the last word on many of Parliament’s decisions. How often they actually disagree with the National Council, vote by vote since 1875 and commune by commune, with live results on vote days.
Open People vs Parliament →
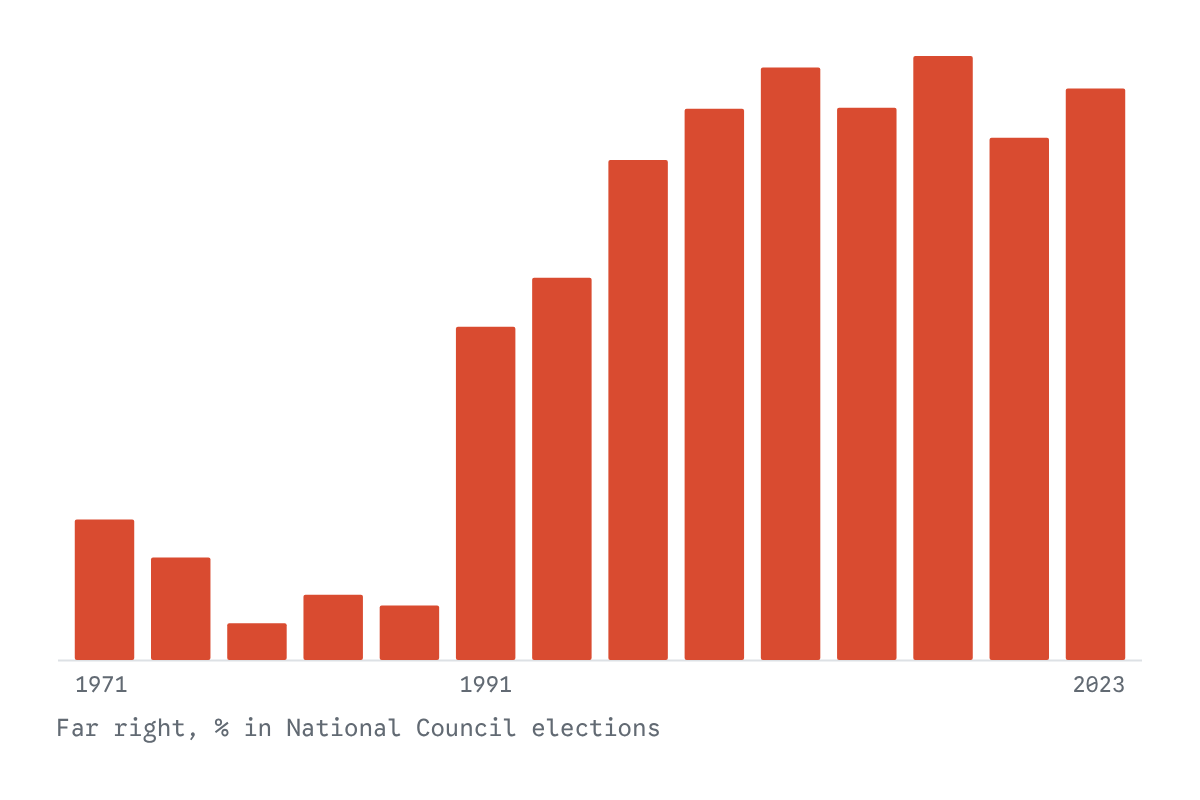
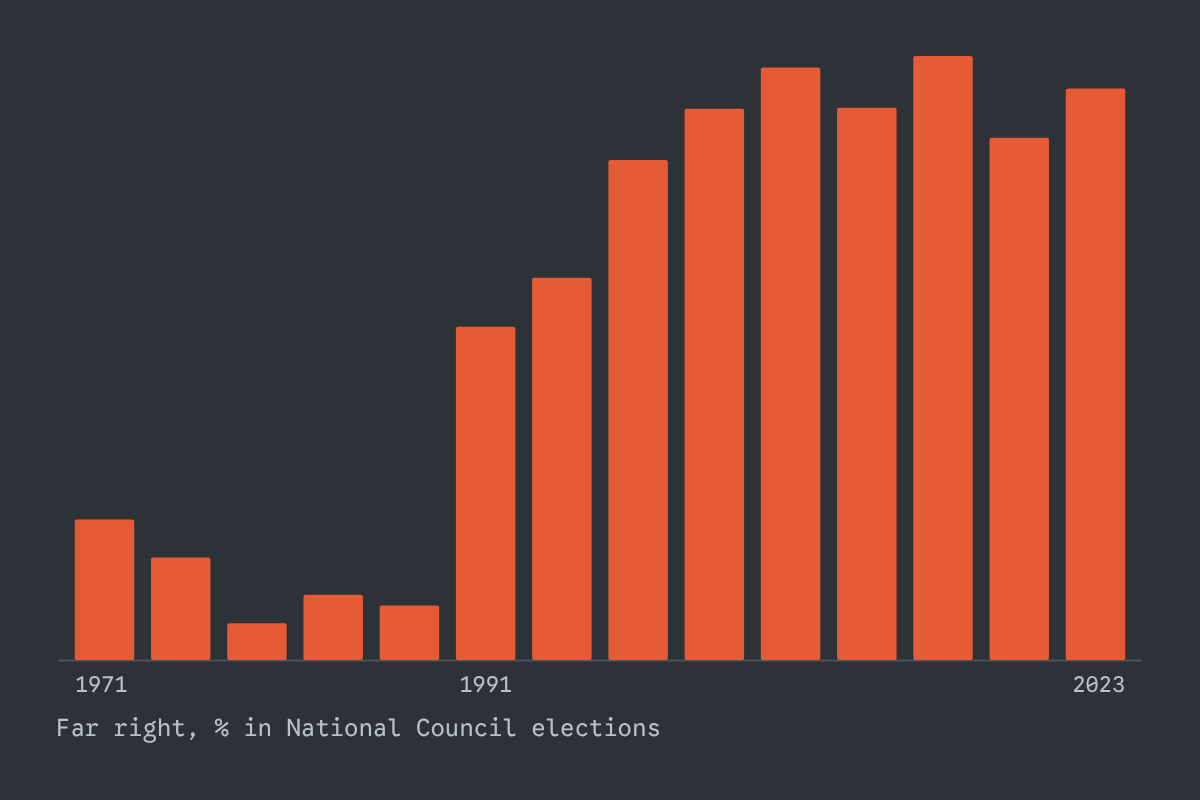
Every National Council election since 1971, canton by canton and commune by commune: from the movement against overforeignization to the SVP.
National Council elections since 1971, canton by canton and commune by commune: from the movement against overforeignization to the SVP, Switzerland’s largest party, and what goes with the far-right vote in each commune.
Open The Far Right in Switzerland →