


Back in March 2023 I came across the Forever Pollution Project, a cross-border investigation into PFAS, the synthetic “forever chemicals”. What caught my attention was that the team had published all of their data with the reporting, which I thought was a truly smart move. It meant people like me could get at the figures, explore them, and form their own view, which is good for transparency and trust.
So I had a go myself. I built a small Shiny app (Shiny is a framework for small web apps in R) on their expert dataset, a CSV hosted by Le Monde, because I wanted to avoid downloading and processing the data before feeding it into a visualisation tool. It had a map, a side panel and a tooltip, with filters and a city search. About 150 lines of code, nothing fancy. I wrote about it in a blog post and put up a project page that still carries the old app. I noted at the time that the app lets one come across biases and flaws in the data. That point matters even more today, because with far more data the map looks much more complete than it really is, and it becomes easier to forget what is missing.
Apart from the open data, why did this topic stick with me? These chemical compounds are toxic, they do not go away quickly, and they are extremely widespread. I find that scary, and I think it needs attention from the public. It is in everyone’s interest to know about the dangers, the extent of the pollution, how people are affected, and how to stay away from these substances, if that is possible at all.
Why it needed an update
That old app is still running, and it still shows the 2023 file. In the meantime the dataset has grown and found a new home, and the tools for building on top of it are very different now. With an AI coding agent like Claude Code, one person can put together something much bigger than I managed on my own three years ago. In my case, Claude Code covers the fields I am not so good at, like the web development aspects that a truly convincing app needs, and also the user experience. So I decided to revisit the app.
Where the data lives now
The people behind this deserve real credit. The original investigation was published in February 2023 by sixteen European newsrooms, who standardised over a hundred data sources into a map and published the data and methodology with it. Afterwards, research projects started contacting the team to reuse the data. At the end of 2023 the CNRS, the French national research centre, took an interest, and in January 2024 it launched the PFAS Data Hub, run by CNRS Humanities & Social Sciences, which has been the home of the data since.
The Hub’s team went back to the raw data of each source. The 2023 version had kept six individual PFAS, a total sum, and values above 10 nanograms per litre (ng/L), which were reasonable choices for a journalistic map. The Hub extends this and keeps all of the substances, and also the values below the detection limit, the lowest concentration a lab can reliably measure. The hand-work was replaced by Python and SQL scripts, so every choice leaves a trace and mistakes can be corrected. Further sources were added, most updating automatically about once a month, and it is all written up in a data paper. None of what I built is affiliated with the CNRS or the Hub. I am simply a grateful user of what they put out, as I was in 2023 with the original project.
What a bigger app allows
The old file held about 44,600 rows, almost all of them known or presumed contamination sites. The new app, which I have called PFAS Atlas, sits on roughly 1.3 million individual samples across 33 countries, going back as far as 1977. The map shows around 107,400 places, of which about 95,000 have measurements and the rest are suspected sites without test results. Each place has a profile, filtered views can be shared by link, and there are CSV and PDF exports. For drinking water, the new app can also check how many samples can even be compared with the EU limit, which the old map could not show.
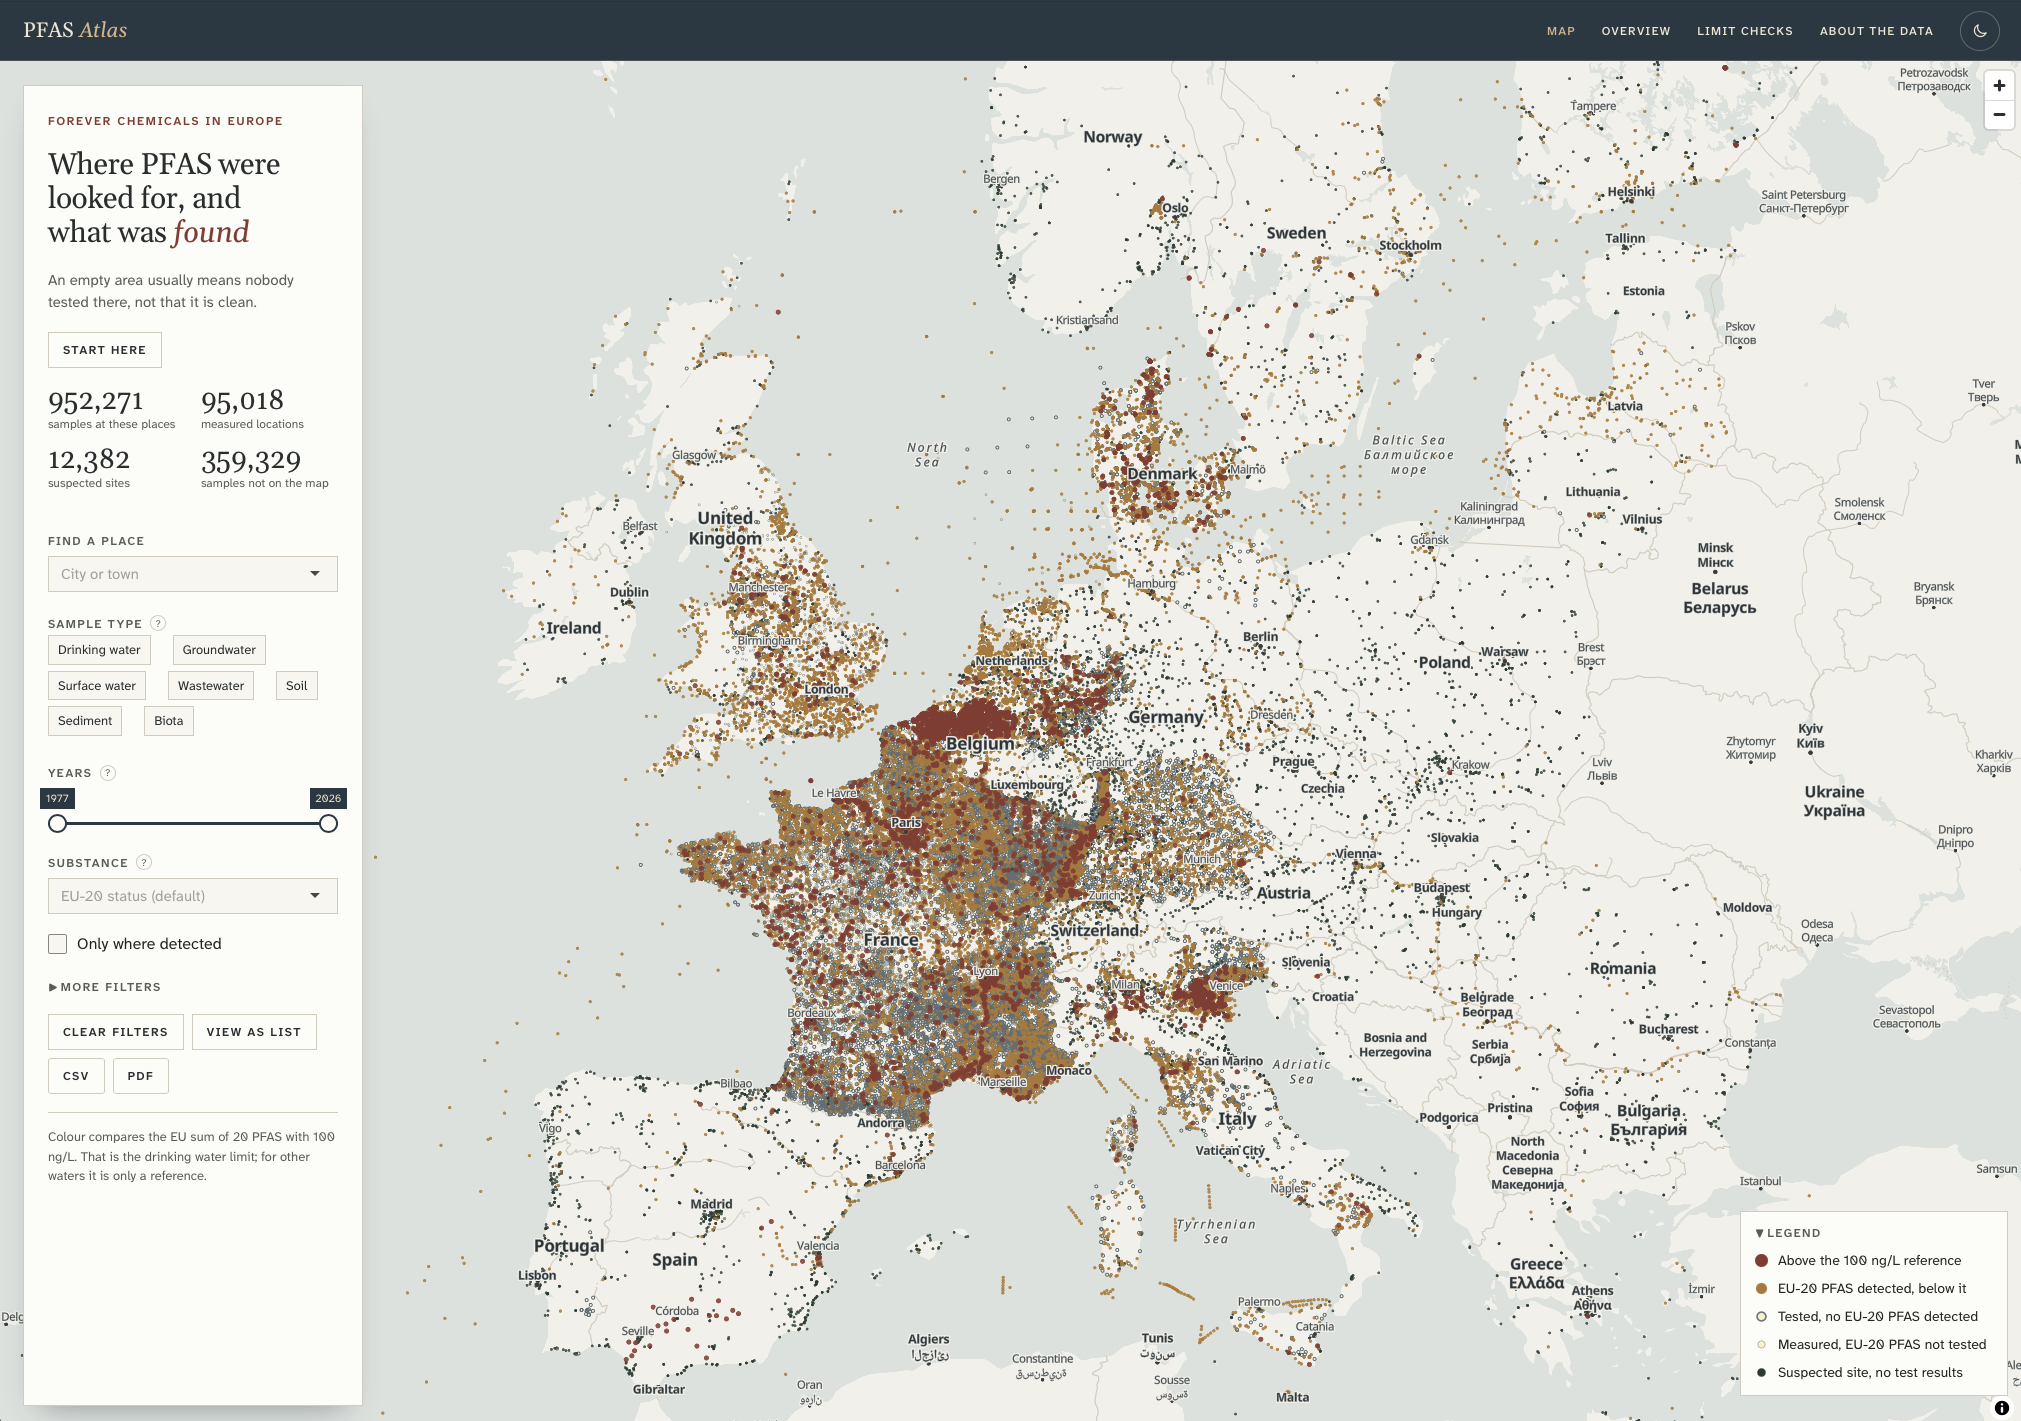 The map of PFAS Atlas. Data: PFAS Data Hub, CNRS Humanities & Social Sciences.
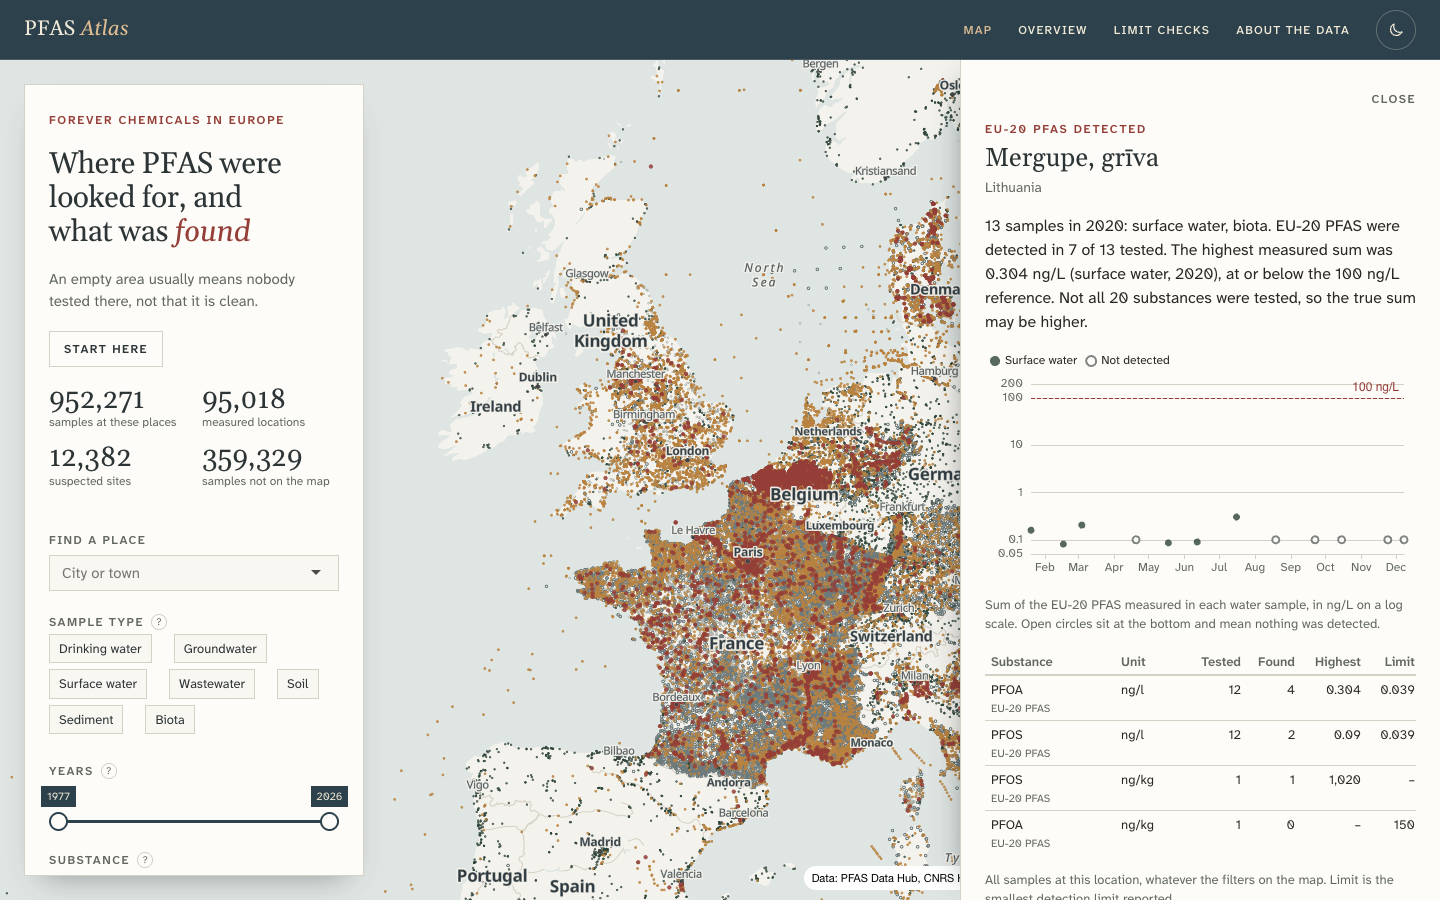 The profile of a single site, here a river mouth in Lithuania, picked as an unremarkable example.
Building it with an AI agent
I built the first app myself. This one I built together with Claude Code in about two days, and it is far more sophisticated, in both design and function, than anything I would have hand-written. Roughly, I set the audience, the priorities and the design direction, reviewed every stage, and flagged whatever felt wrong when I actually used it. The agent did the data profiling, most of the research, the code and the testing.
One early decision came down to a measurement. The agent’s first research recommended a mainstream R mapping package, mapgl, but a timed test showed filter changes taking the best part of a second at best and several seconds at worst, while drawing the points straight on the graphics card brought the redraw down to about 7 to 16 milliseconds. So the first recommendation was reversed on the evidence.
Some things also went wrong along the way. The map first went out with no place names on it at all, because a filter looked for layer names the map did not have, and the automated checks passed anyway. I only caught it by using the thing and losing my bearings. As I told the agent at the time, without the names the map loses orientation (“Where am I?”). The substance statistics had a different problem. The first version claimed every substance was detected in 100% of tests. Missing values had dropped all the tests that found nothing out of the calculation, leaving only the positive ones. The agent spotted that itself, because the number was implausible, fixed it, and added a test.
So automated tests seem to catch mainly what someone thought to test in advance, and here no test covered either problem. One came up through using the app and the other through a plausibility check, and both still matter, whoever writes the code.
What the data still can’t tell
What the data can’t show connects to what I wrote in 2023 about biases and flaws, only now I can be far more specific. The map shows where people have gone looking for PFAS, which is a different matter from where the pollution actually is. The app opens by saying so: “An empty area usually means nobody tested there, not that it is clean.” Poland and Austria, for instance, appear almost empty for measurements in this data. That says nothing about the actual pollution in these countries, because the data can only hold what was measured and collected.
Coverage follows testing, so a region with a good monitoring programme fills up with points while one that tested little stays blank. Belgium has dense data largely because of a single regional database in Flanders. The data is also heavily skewed, with about 83% of all samples coming from France alone. The Hub’s own team makes the same point in their data paper, writing that “the gaps observed in the map primarily reflect data deficiencies rather than pollution-free areas.”
However, even where there are points, it matters what was tested in each sample. There is a convenient column that sums up every detected substance in a sample. But each sample tested a different set, and the column even mixes in things like fluorinated pesticides, so those sums cannot be compared from one row to the next. Likewise, a sum of zero only means nothing was found among whatever was tested.
Germany, Italy and the Netherlands have no drinking water samples in the data at all, only other kinds, so they drop out of the check against the EU limit entirely. When I first saw Germany missing it looked like a bug. It was correct, but the app did not explain it, so now it does. The gap is in this dataset, which only holds results that were published and collected. Drinking water may well be tested in these countries without the results ending up here, so the app adds that the missing samples do not mean their water goes untested.
The drinking water check has its weak points too, which the app tries to state. Since January 2026, the sum of twenty PFAS in drinking water must not exceed 100 ng/L under EU rules. The app sorts each sample into one of four outcomes: above the limit, below it, inconclusive, or not assessable. The main result is that about 81% of the drinking water samples can’t be judged at all, because none of the twenty substances were tested in them. Between “above” and “below” there is an asymmetry. If the substances actually measured already exceed 100 ng/L, testing the rest could only raise the total, so the sample is above 100 ng/L even on an incomplete test. Being sure a sample is under 100 ng/L is harder, because a substance that was never tested could still have carried enough to cross it. That is why the app calls a sample inconclusive when too few substances were tested or the detection limits were too high. And a single sample is only a snapshot and no official finding, samples from before January 2026 were not yet subject to the limit, and whether a supply complies is for the authorities to say.
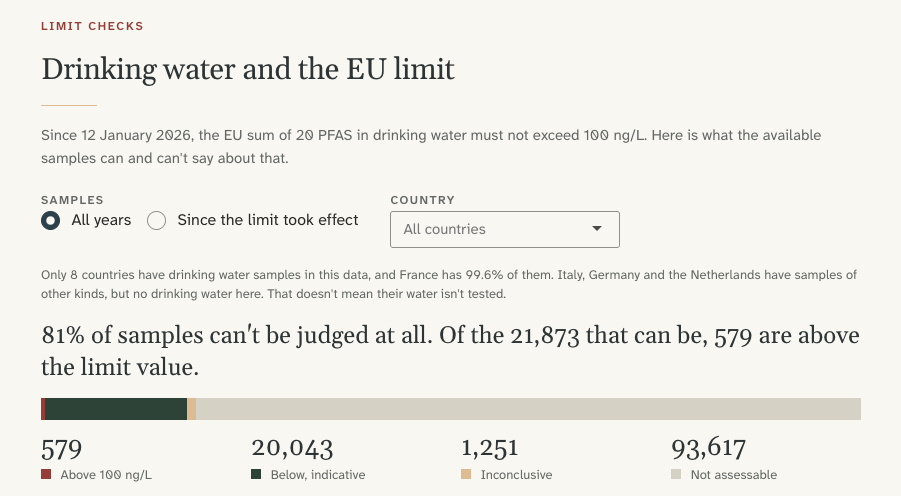 The limit check for all years, including samples from before the limit took effect.
Why this is easy to get wrong
I can imagine an estate agent telling a buyer the area is safe, when the only basis is that no point shows up nearby on the map. But a blank spot usually means nobody tested there, or the results never reached the data, so the map says nothing about that area either way. The opposite mistake is also possible. A dense cluster of points looks alarming, and it is tempting to read it as the worst place around. It may just mean the area was monitored more closely, perhaps because a local concern prompted testing, and testing tends to lead to more testing in the same place.
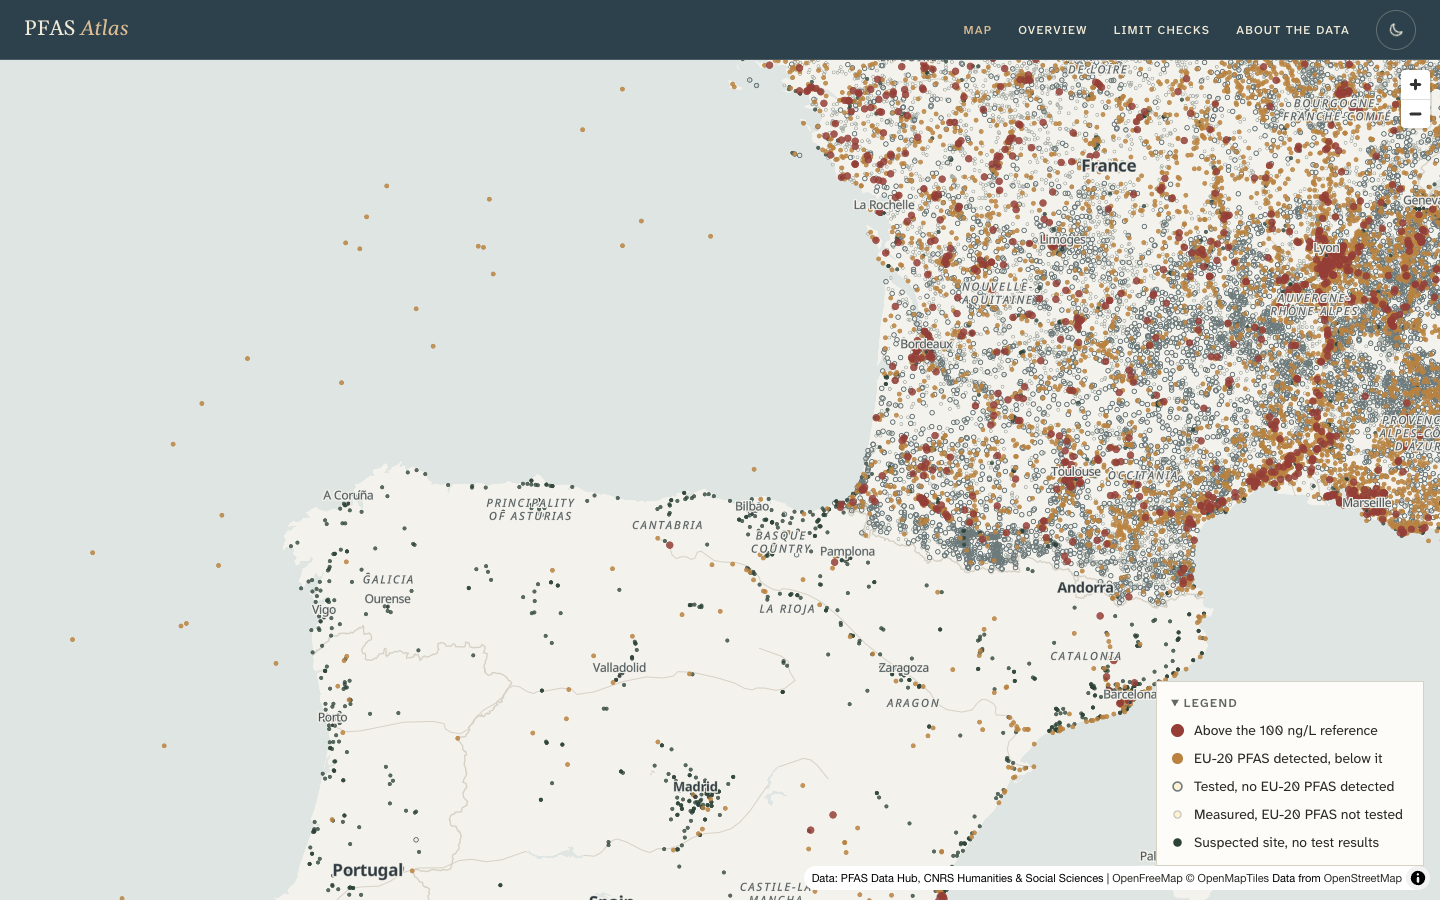 Dense points in France and far fewer in Spain. A sharp change along a national border is a strong hint that the pattern comes from testing and data collection.
So, before reading any map of measurements
I now keep one question in mind for any chart built on collected data. Before reading a pattern in the data as a fact about the world, ask whether the same pattern would still appear if it only reflected where people happened to test. If so, the pattern could simply come from the testing, and the map can’t really tell us about the pollution there.
You can have a look at PFAS Atlas here. As in 2023, if you spot a mistake, or a flaw in how it reads the data, I would genuinely like to hear about it.