Recently, I was wondering which songs I listen to most often on Apple Music. Sure, Apple Music can show you the “Top 25 Most Played” songs. However, it didn’t provide me with the instant overview I wanted. And it’s not made for conditional filtering.
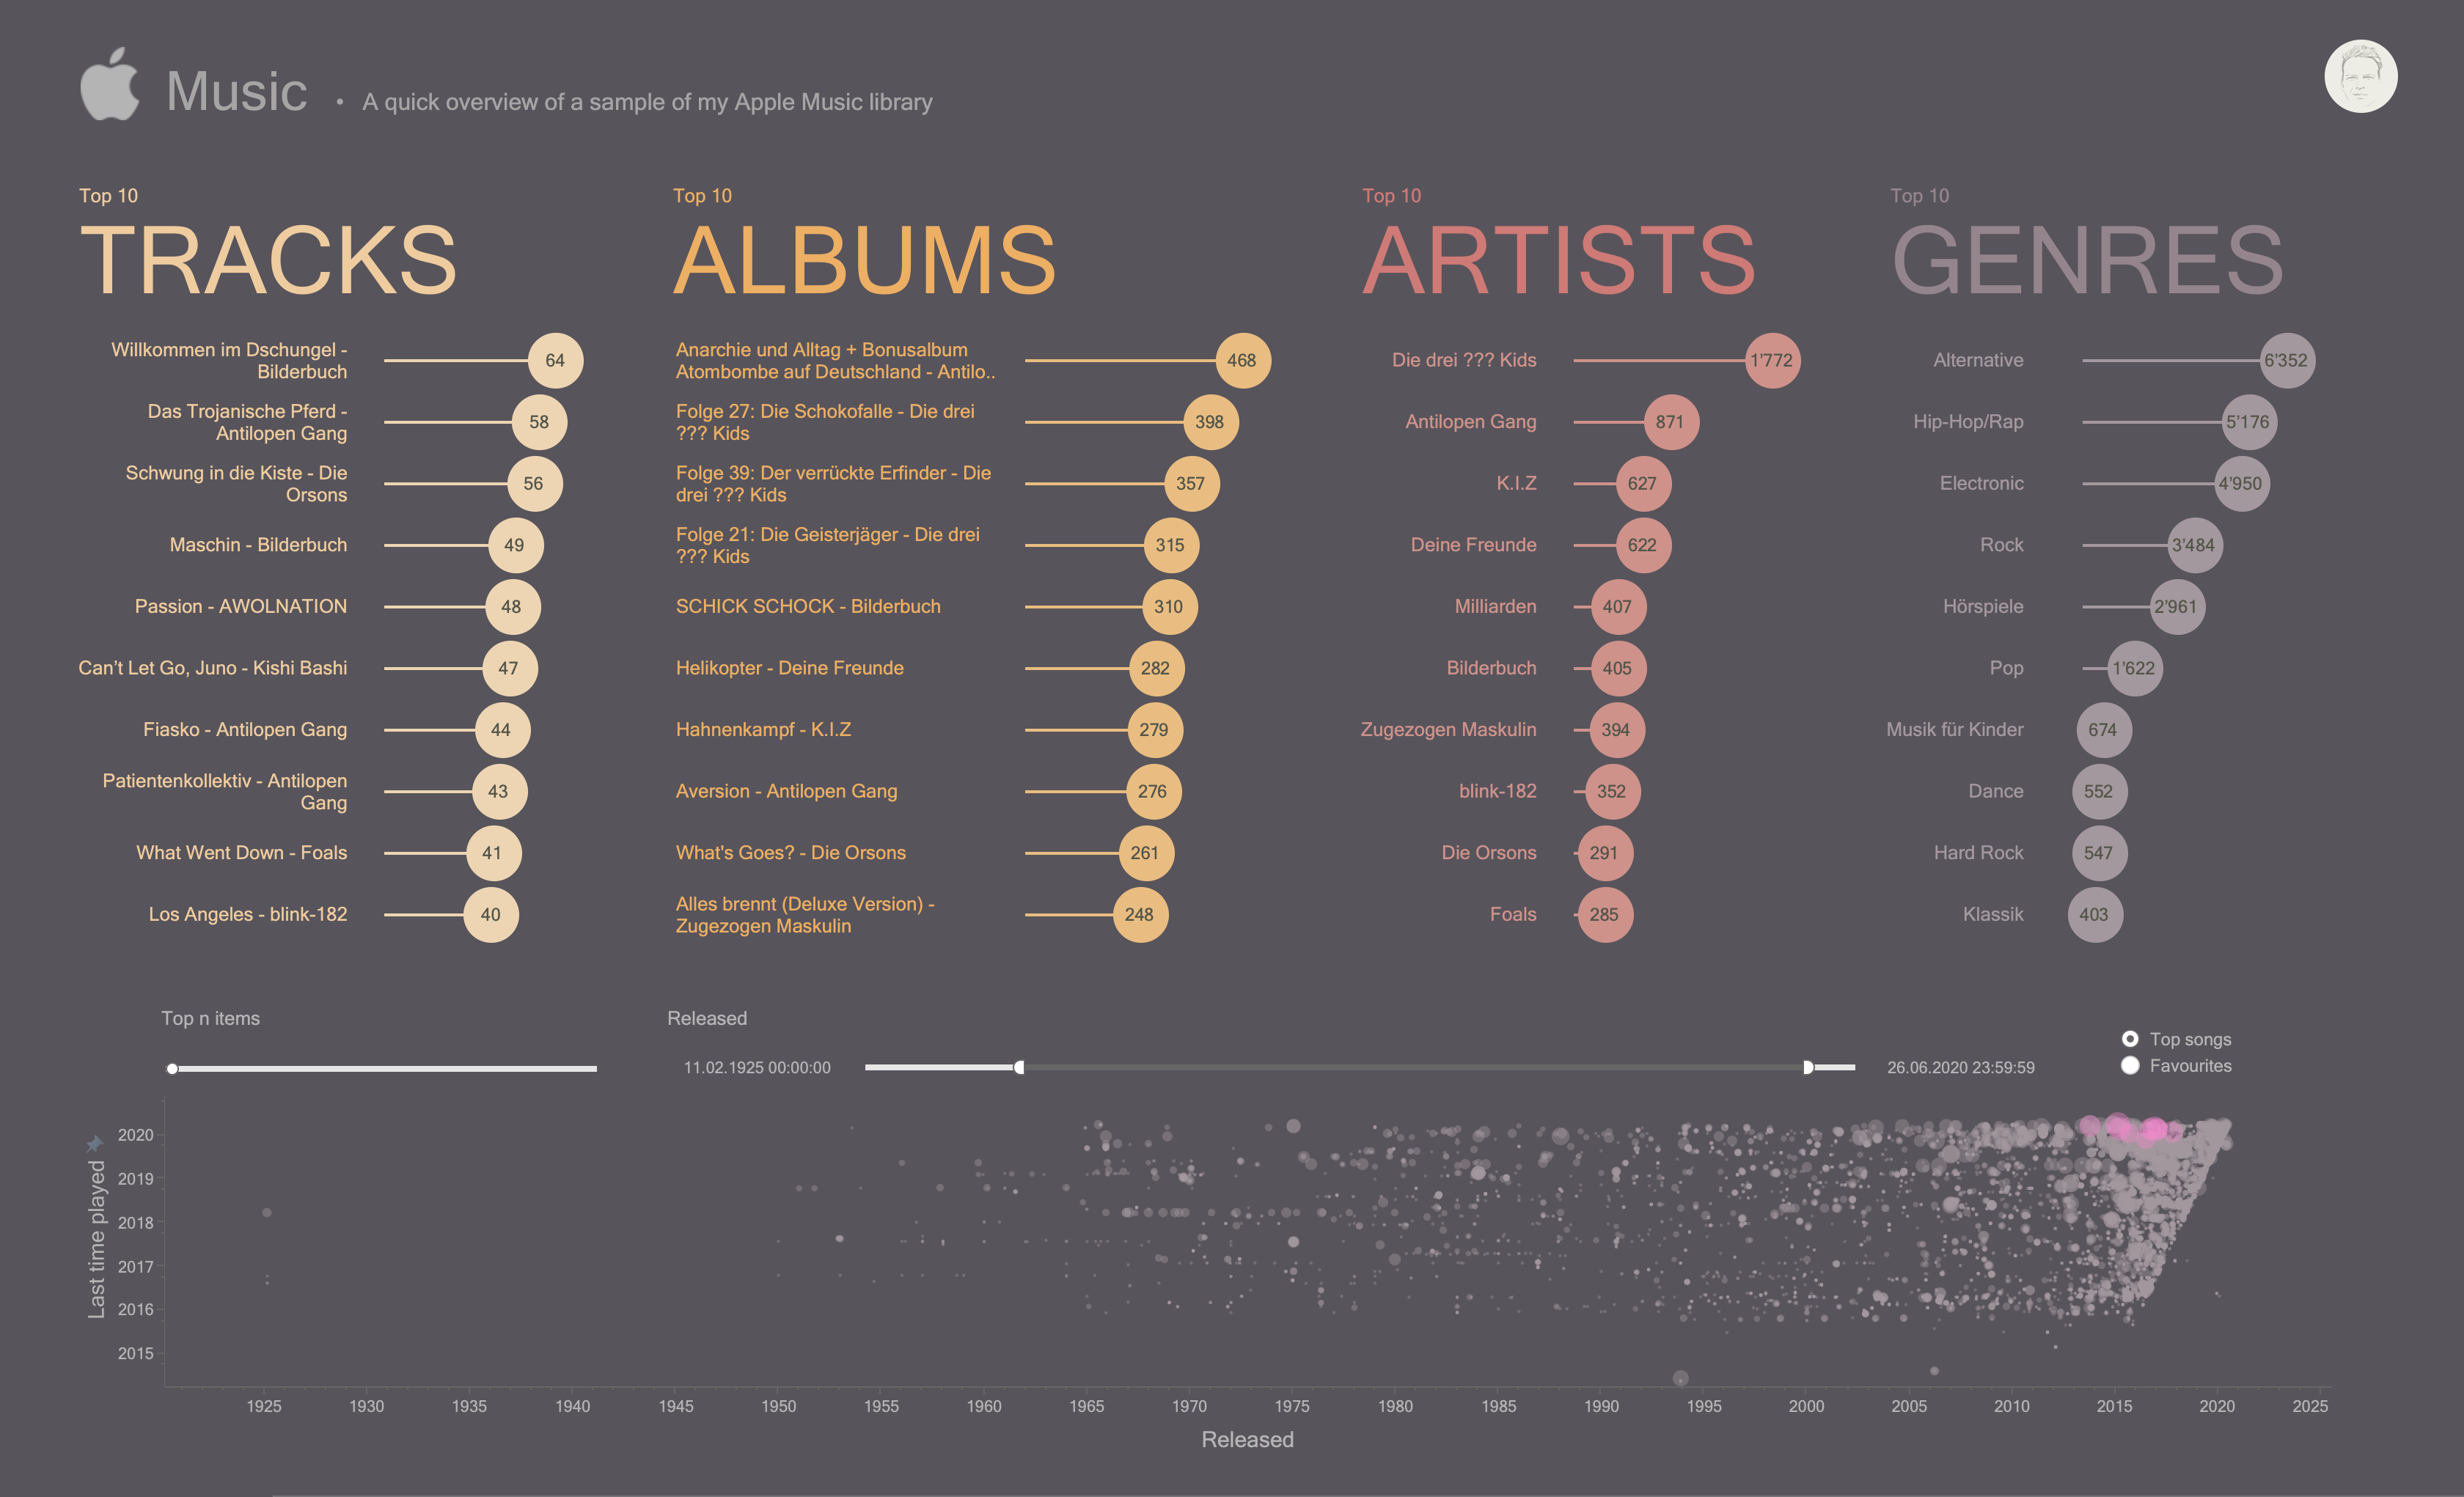
So, I exported the library, read and processed the .xml file in R, created an excerpt, and visualised this sample in Tableau. Well, that worked quite nicely… You can have a look at the result on Tableau Public or watch a demo on Vimeo.
That said, the very first thing I realised when looking at the dashboard: my kids have a huge impact! Just watch out for “Die drei ??? Kids” or “Deine Freunde”…
You want to have a look at your Apple Music Library, too? You have R and Tableau (Public)? Just follow these really simple steps.
Step 1
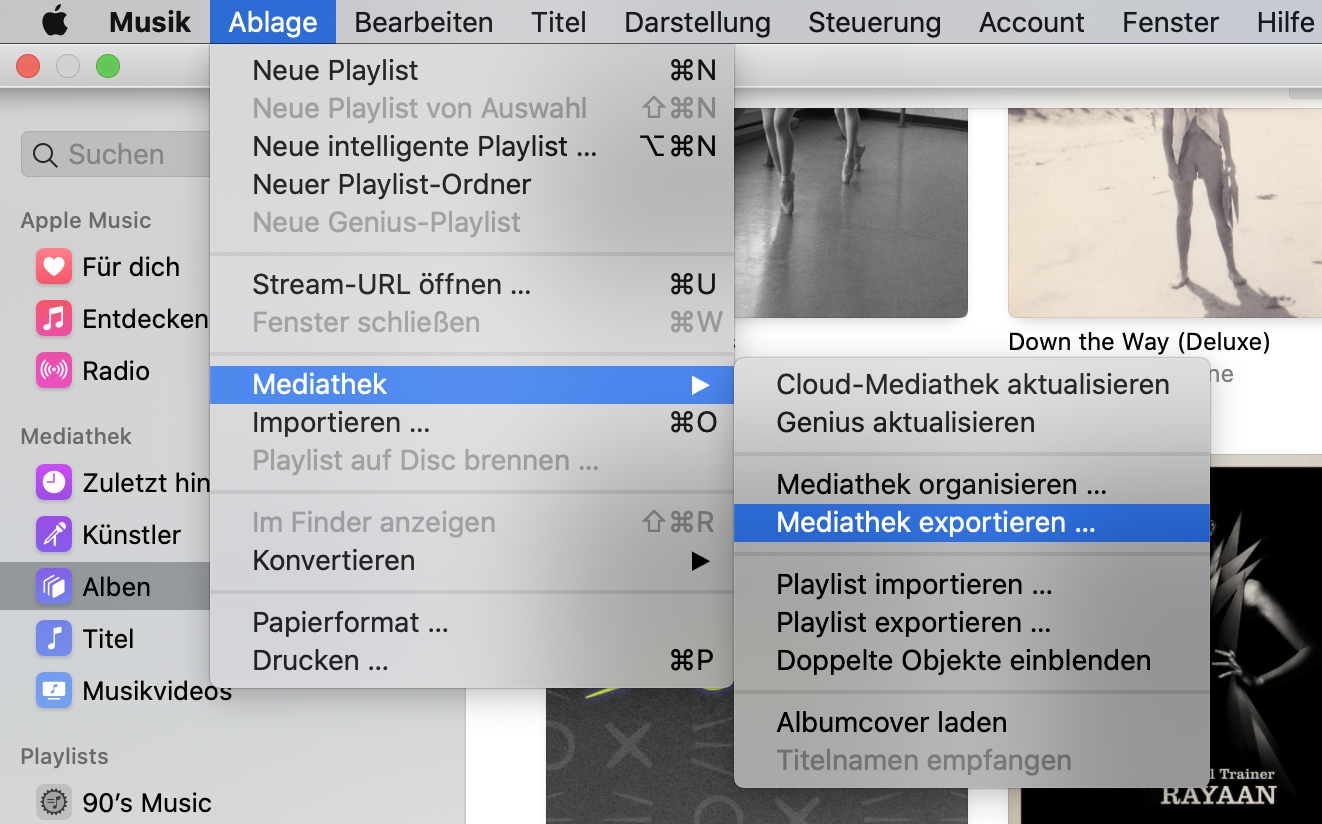
First, you have to export your library to your project folder. You can do this by selecting the export function from the menu:
Step 2
Use this R snippet to read and process the .xml file. It might be a bit confusing when first working with .xml files. However, once you understand their structure, it’s straightforward to generate a nice and clean tibble. The output is then saved to a folder in your project to be read in with Tableau in step 3. (I admit that this was also the first time I worked with .xml files…)
rm(list = ls())

library(tidyverse)
library(xml2)

dd_xml <- read_xml("~/...ProjectFolder.../Input/Mediathek.xml")

track_info_nodes <- xml_find_all(dd_xml, "/plist/dict/dict/dict")

track_info_text <- xml_text(xml_children(track_info_nodes))

dd <- tibble(category = track_info_text[seq(1, length(track_info_text), 2)],
             value = track_info_text[seq(2, length(track_info_text), 2)]) %>%
  mutate(track_id = ifelse(category == "Track ID", value, NA)) %>%
  fill(track_id) %>%
  pivot_wider(., id_cols = track_id, names_from = category, values_from = value) %>%
  select(., -track_id)

write_csv(dd, "~/...ProjectFolder.../Output/Mediathek.csv")
Step 3
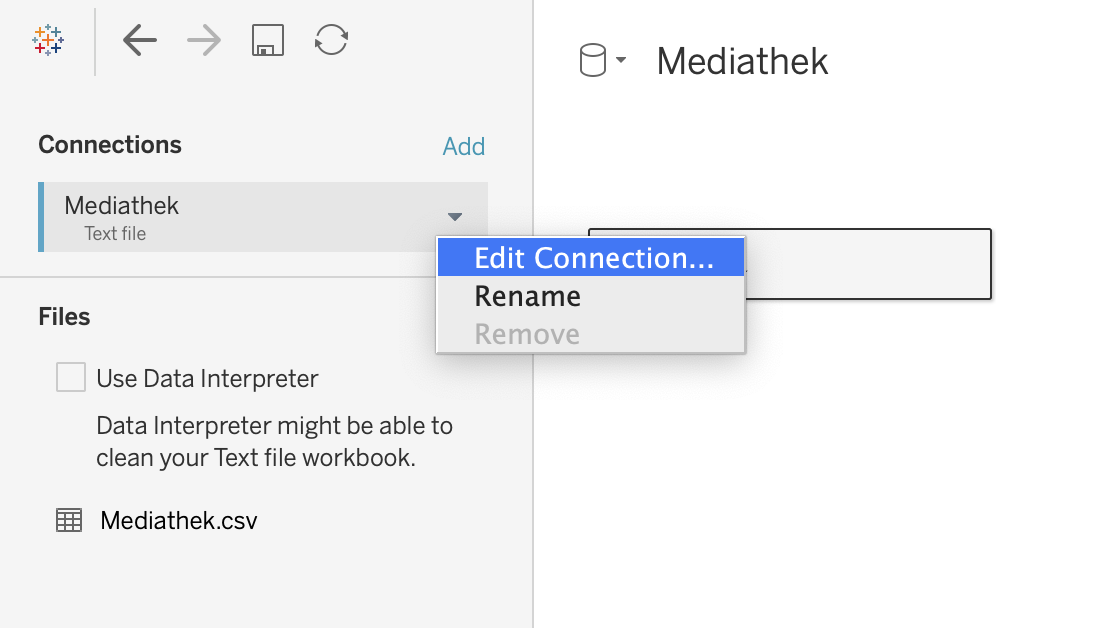
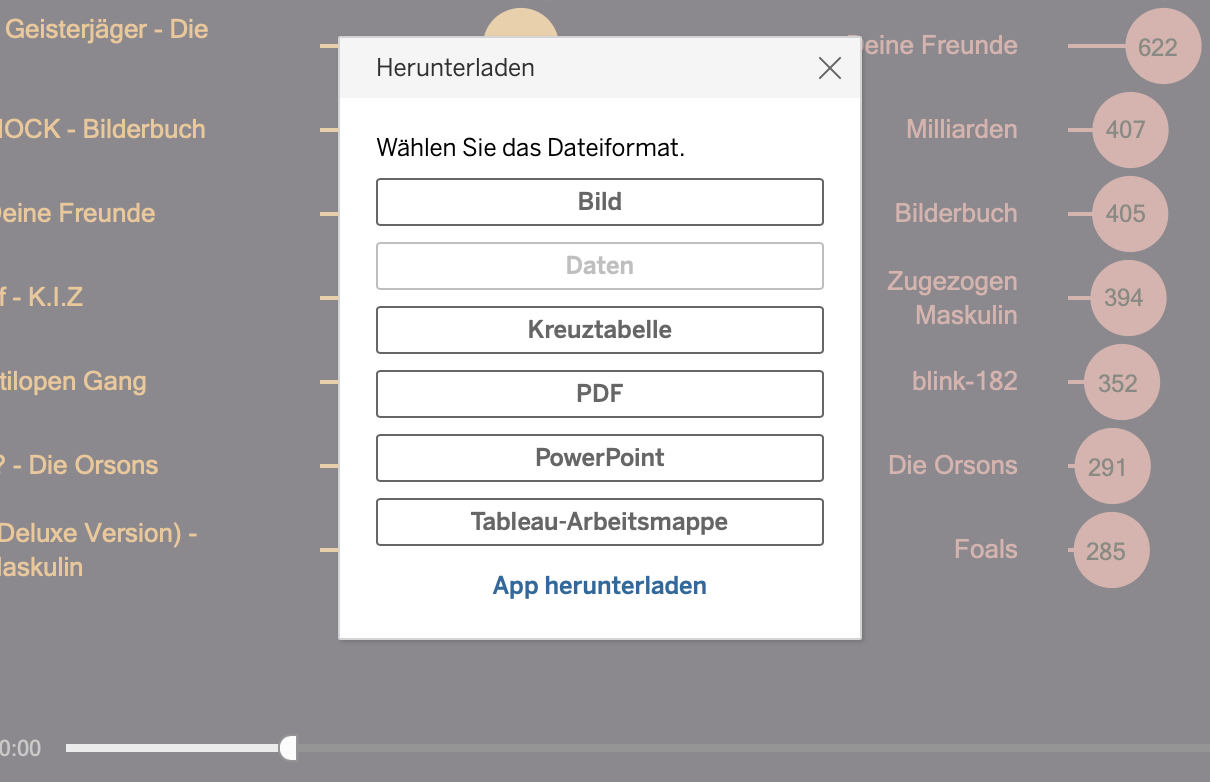
Finally, you can download the Viz from Tableau Public…
… to then open it and replace the data source. Voilà!