Here are some projects that I have done using the R package Shiny. Shiny allows to make interactive web apps straight from R. That is, people who are not familiar with code are given the opportunity to explore data and infer insights from it. Really nice!
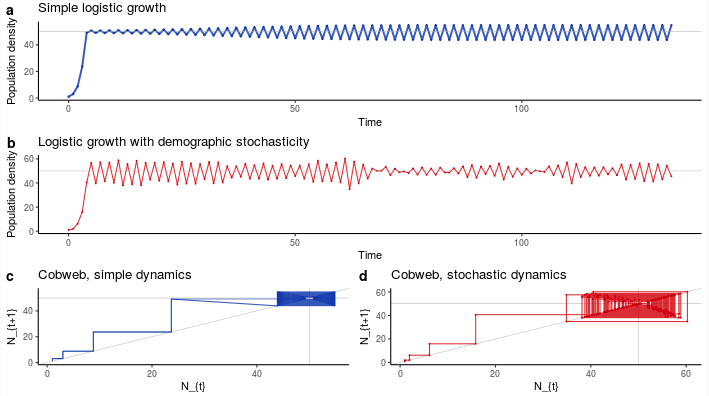
- Discrete logistic growth: Time-discrete population growth, the road to chaos, and a comparison to the case when additional, demographic stochasticity is present.
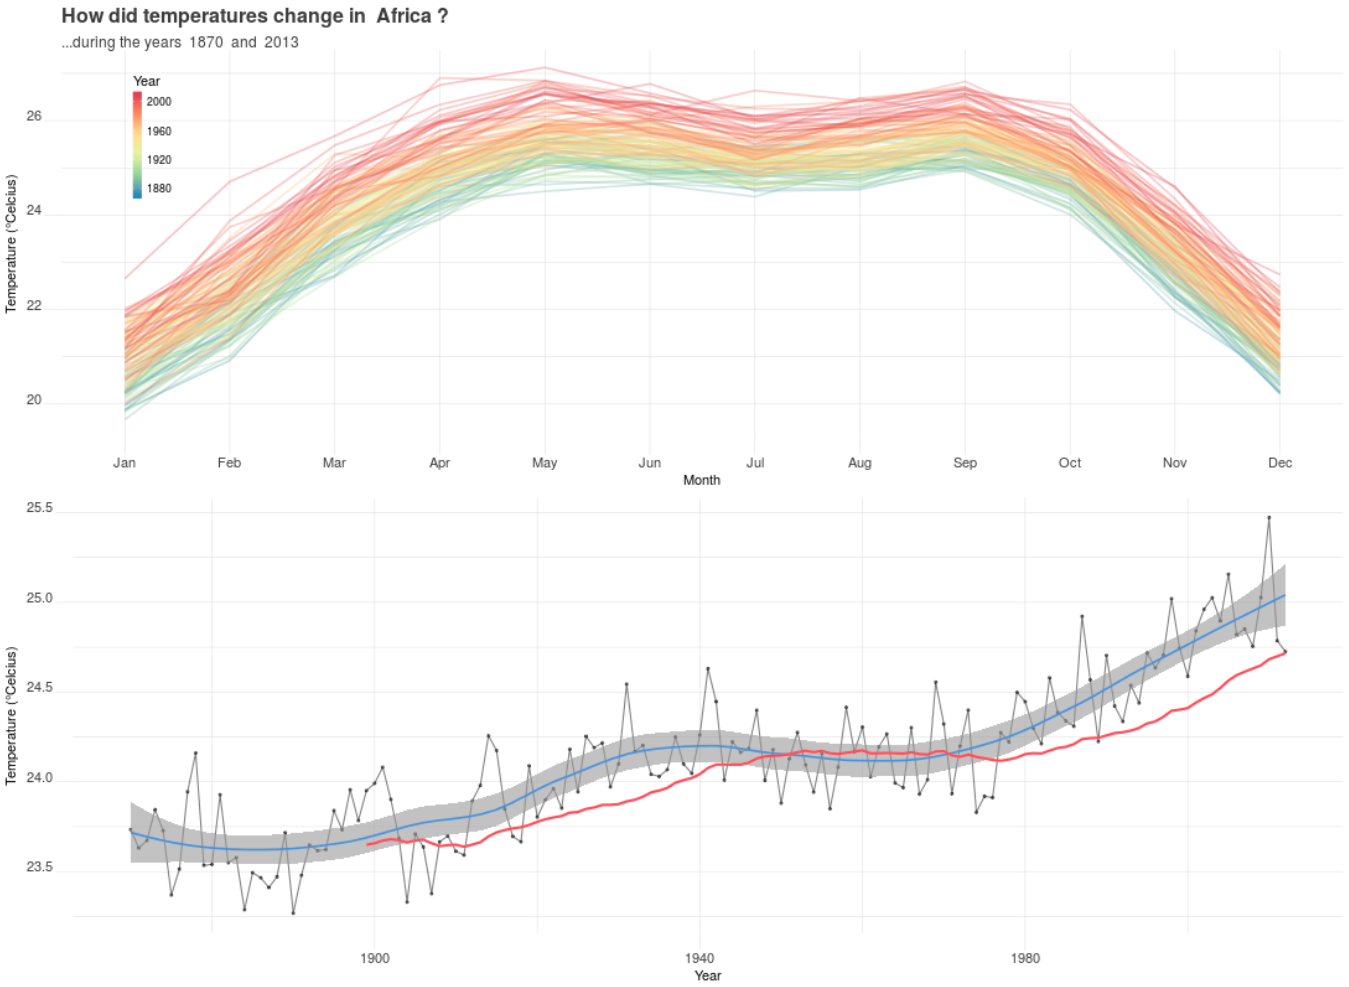
- Climate data: Have look at the climate of specific countries and regions in the world and how average temperatures changed there.
- Hurricanes and typhoons: Get an idea about hurricanes and typhoons: their paths and strengths, as well as a couple of summary statistics.
Discrete logistic growth
Imagine an organism that propagates once a year, and all individuals within a population do so at the same point in time. This is the case for many, many living creatures, especially when their life cycle is influenced by seasons. That is, there are specific conditions during a year that are more favourable than others for fathering and raising offspring. Without any restrictions related to population density (food, diseases, competition…) such an organisms would show exponential growth. For example, if any individual would create two descendants, then the population would evolve according to 2n, with n being the number of reproduction cycles, i.e., years.
However, we all know that no population growths without limits. There are certain factors that regulate the number of individuals, such as the availability of resources (food, space…), or the susceptibility to diseases. These factors are related to the number of individuals living in a given space, i.e. the population density. That is, the growth of a population is density dependent.
Now, there are a couple of possibilities of how to model density-dependent population growth. The most popular one is the so called logistic map (a discrete version of the Verhulst equation). It is pretty simple to understand: A population starts at low density and grows towards a specific density value that is sustainable for a given space of set of conditions, called carrying capacity. In the time-continuous version, the result is a smooth saturation sigmoidal curve. However, in the discrete version the population can shoot over the carrying capacity. This might lead to (damped) oscillations or even chaotic dynamics. The crucial parameter that defines the kind of dynamics is the growth rate. Have a look at the app and you will get an idea about this very simple road to (deterministic) chaos.
Climate data
Explore climate data from different countries and regions, and get an idea about what the annual cycle of average surface temperatures looks like. For example, it is intereting to see in which regions the cycle shows an unimodal shape with a maximum in June/July/August (Northern hemisphere), or when this peak is shifted to November/December/January (Southern hemisphere).
You can find the app here.
Hurricanes and typhoons
(comming soon)