Global terrorism.
Posted on June 15, 2018
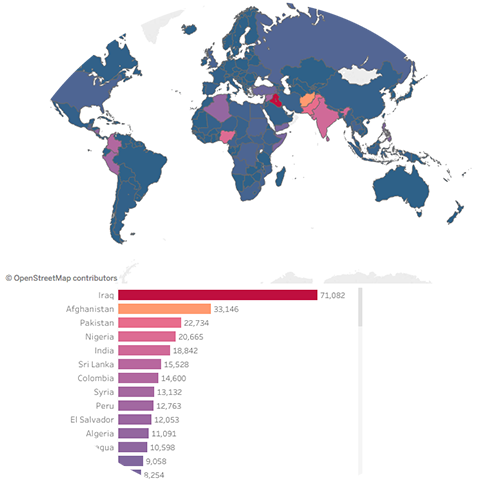
Interested in when and where terror attacks occurred? Then go and have a look at this project in which I visualised data from the global terrorism database (GTDB) using Tableau Public. You can find it here.
Tags:
data analysis, terrorism, GTDB, visualisation, Tableau
Storm data exploration using Tableau.
Posted on February 7, 2018
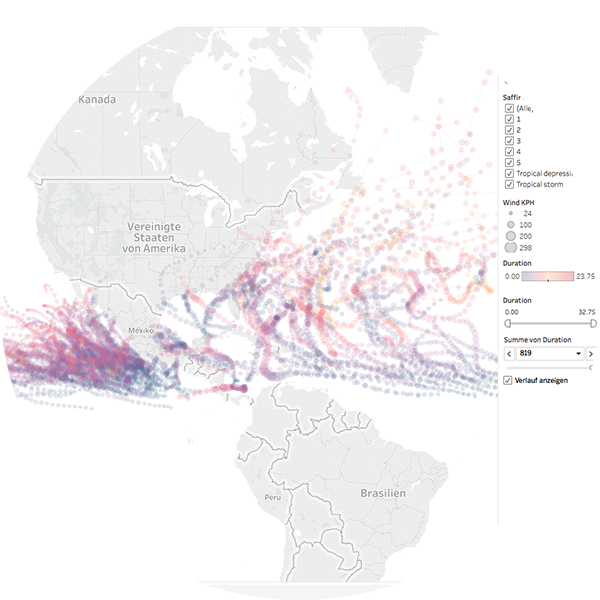
Another way of exploring the HURDAT2 data set is employing Tableau, a pretty nice software for analysis and visualisation of data.
[Read More]
Tags:
data analysis, storms, HURDAT2, visualisation, Tableau
Further exploration of storm data.
Posted on February 6, 2018
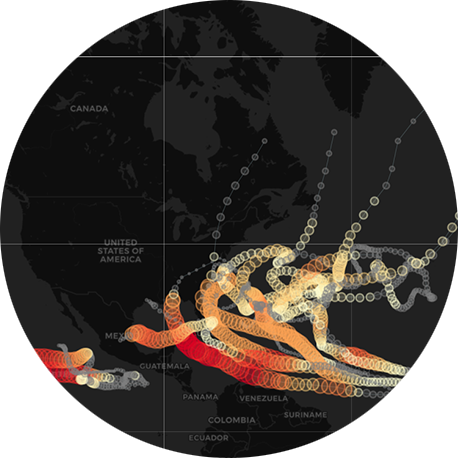
The next part of my HURDAT2 data exploration is online. The leaflet objects could not be exported to an .md file for use with GitHub pages. Hence, I simply added the .html file. Though lacking the nice formatting, everything else works nicely… =)
Tags:
data analysis, storms, HURDAT2, visualisation
First part of storm exploration is online.
Posted on January 25, 2018
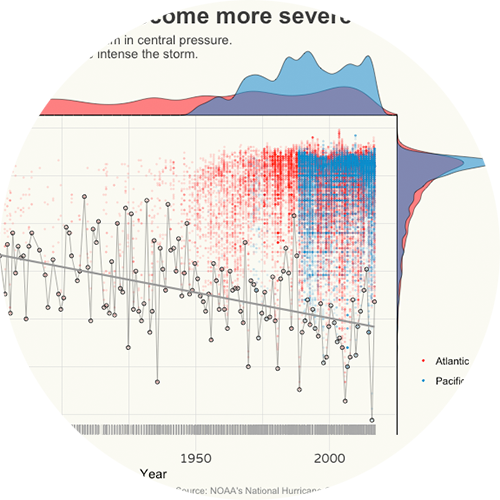
Finally, the first part of my analysis/exploration of storm data from the HURDAT2 data set is online. I was about to write ‘done’, but, actually it’s done since a couple of days. However, I wasn’t able to embed all figures when exporting R markdown files with R Studio to .md...
[Read More]
Tags:
data analysis, storms, HURDAT2, visualisation
Photography section added!
Posted on January 8, 2018
Hey there! I now included a section referring to my photographical work, which can be found in a more comprehensive manner under thommasmmassie.com. You are more than welcome to have a look at it!
Tags:
photography, pictures, news